
You've seen a thousand candlestick "cheat sheets." Colorful little diagrams with arrows: hammer = up, shooting star = down. Memorize the shapes, print the PDF, get rich. Then you take a hammer trade into a wall of sellers and get stopped out in ninety seconds, and you decide candlesticks are astrology for men.
They're not. But the cheat-sheet version of candlesticks is astrology, because it strips out the only thing that matters: where the candle happened and what was pushing it. A candle is not a signal. A candle is a record of an auction — a confession of what buyers and sellers were willing to do with real money over a fixed slice of time. Read the confession, not the shape.
This is the complete playbook. Anatomy first, because you can't read a language you can't spell. Then the mechanism — why these patterns encode information. Then every pattern that actually matters, single-bar through three-bar, with real numbers. Then the part nobody teaches: where these patterns work, where they fail, how they behave in different market regimes, how they stack across timeframes, how to fuse them with two or three other tools, and the HPT rule that will save you more money than any single setup — read multi-bar structure, not single candles in isolation.
By the end you'll have a mechanical, repeatable process and the judgment to know when to break it. Let's build it so you can use it Monday.
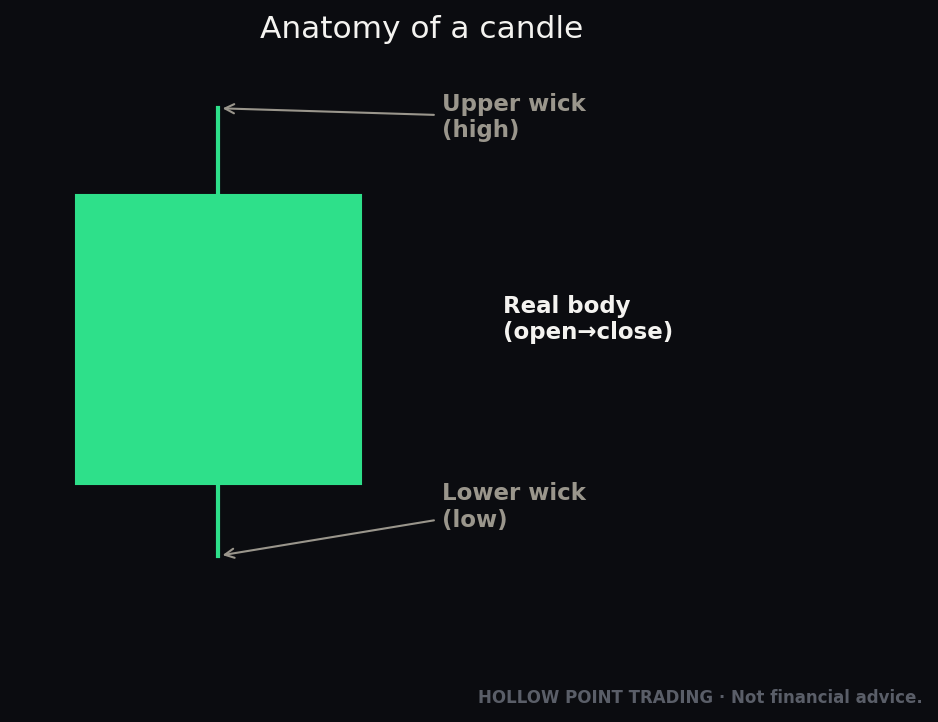
What a Candle Actually Is: The Anatomy
One candle covers one unit of time — a 5-minute candle covers five minutes, a daily covers a day. In that window, four prices get recorded:
- Open — the first traded price of the period.
- High — the highest price touched.
- Low — the lowest price touched.
- Close — the last traded price of the period.
The body is the rectangle between open and close. Green (or white) body: close was above open — buyers won the period. Red (or black) body: close was below open — sellers won. The body is the settled outcome.
The wicks (also called shadows or tails) are the thin lines above and below the body. The upper wick runs from the top of the body to the high — it marks territory buyers reached and then lost. The lower wick runs from the bottom of the body to the low — territory sellers reached and then lost.
Here's the mental model that unlocks everything: the body is where price ended up; the wicks are where price was rejected. A long lower wick isn't "down" — it's the exact opposite. It means price fell, buyers stepped in hard, and drove it back up before the bell. Rejection of lower prices is bullish. Rejection of higher prices is bearish. Beginners read the color; pros read the wick.
Concrete example. NQ (Nasdaq-100 futures) prints a 5-minute candle: open 20,050, high 20,058, low 20,012, close 20,052. The body is small and green (20,050 → 20,052, two points). The lower wick is enormous: from 20,050 down to 20,012, that's 38 points of ground given up and taken back. Upper wick is tiny (20,052 → 20,058). Translation: sellers shoved price down 38 points, buyers rejected all of it and closed near the highs. That is a buyer's candle wearing a small green body. The wick told the story the body whispered.
The Close Is the Vote That Counts
Here is a refinement most traders never internalize: of the four prices, the close is the one that carries the most information. The high and low are the extremes reached — the boundaries of the fight. The open is just the starting whistle. But the close is where the market voluntarily ended the period with real capital still committed. When a bar closes near its high, buyers were willing to hold longs into the bell despite every chance to take profit. When it closes near its low, sellers held shorts into the close.
This is why the phrase "wait for the close" matters so much. A 5-minute candle can spend four of its five minutes looking like a screaming hammer, then get slammed in the last thirty seconds into an ugly bearish close. Until the bar closes, the pattern is a rumor. The confession isn't signed until the pen leaves the paper.
Body-to-Range Ratio: Measuring Conviction
You can quantify how much a bar "means" with a single number: the body-to-range ratio. Take the body size (absolute value of open minus close) and divide it by the total range (high minus low).
- Ratio near 1.0 → marubozu territory, near-total conviction, one side dominated.
- Ratio around 0.5–0.7 → healthy directional bar with some fight.
- Ratio under 0.3 → mostly wick, mostly rejection — a doji, spinning top, hammer, or star family bar.
Run the NQ example: body 2 points, range 46 points (20,058 − 20,012). Ratio ≈ 0.04. That's an almost pure rejection bar — the two-point green body is noise; the 38-point lower wick is the entire story. Training your eye to estimate this ratio at a glance turns candle-reading from vibes into measurement.
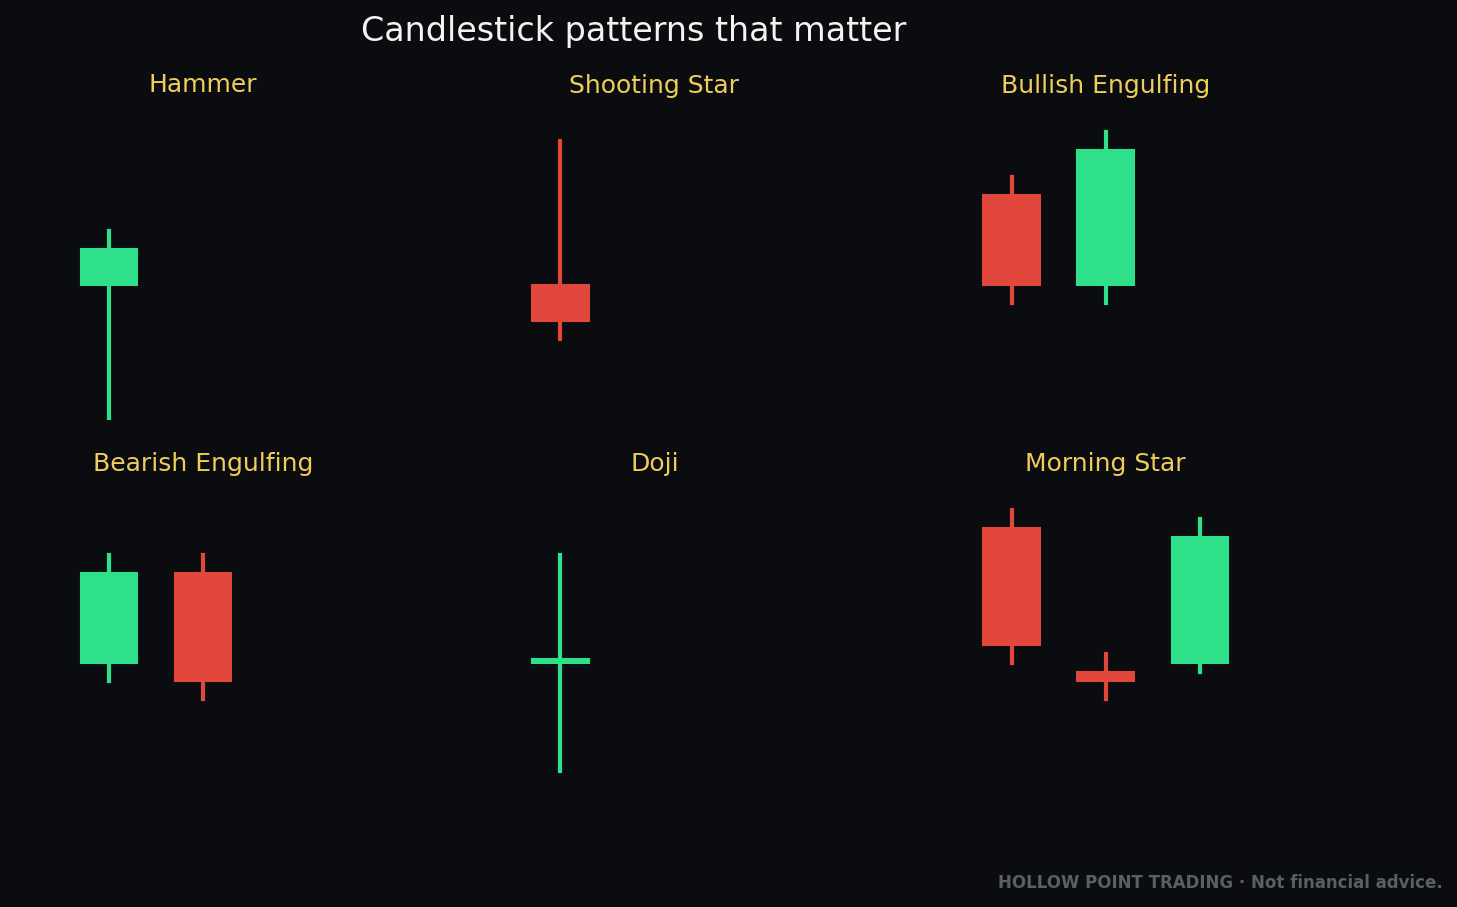
Relative Size: A Candle Is Only Big Next to Its Neighbors
A "large" candle is meaningless in absolute terms. Forty points on NQ is enormous on a 1-minute chart at 3 a.m. and a rounding error on a daily chart during an earnings week. Size is always relative to the recent average true range. When a bar's range is two or three times the average of the last ten bars, that is a large candle — a volatility expansion that says something changed. When you read "large red down candle" anywhere in this playbook, read it as "large relative to the bars around it," never as an absolute point count. This single adjustment stops you from over-reading noise on fast timeframes and under-reading real moves on slow ones.
The Mechanism: Why Any of This Works
Candlesticks work because an auction leaves footprints, and footprints predict the next few steps.
At every price, someone thinks it's cheap and someone thinks it's expensive — otherwise there's no trade. The candle records who was more aggressive. When buyers repeatedly reject a price (long lower wicks stacking at the same level), it means real size is defending that zone. That size doesn't vanish at the close. It's still there next bar, and the bar after. The pattern isn't magic — it's a snapshot of order flow that persists.
This is also why the location matters more than the shape. A hammer (long lower wick, small body up top) at a support level you've already got drawn means buyers are defending a place other traders also care about — the rejection has backup. The same hammer in the dead middle of a range means buyers defended a level nobody's watching, so nobody reinforces it, and price drifts back through. Identical candle. Opposite value. The pattern is a fingerprint; the level is the crime scene. No crime scene, no case.
What's Actually Happening Under a Long Wick
Let's get literal about order flow, because it demystifies everything. A long lower wick forms through a specific sequence. Sellers hit bids aggressively, price drops fast, and it runs into a cluster of resting buy orders — limit bids sitting at a level, plus stop-buy orders from shorts covering, plus fresh market buyers who think the dip is a gift. That demand absorbs the selling. Absorption means the aggressive sellers run out of willing counterparties at low prices, and the moment selling pauses, the imbalance of remaining buyers snaps price back up. The wick is the visual signature of absorption: a price zone that got hit and immediately rejected because the resting size was bigger than the aggression.
Now you understand why the level matters. Resting size doesn't accumulate randomly. It accumulates at prices people are watching — prior swing lows, the prior day's low, a round number, a Fibonacci pocket, VWAP. The wick and the level are two views of the same fact: there's more size than aggression at this price. The candle shows you the rejection; the level tells you the rejection has reinforcements that will still be there on the next test.
Why Patterns Decay Over Time
One honest caveat that separates realists from cultists: candlestick patterns were codified by Japanese rice traders centuries ago and popularized in Western markets in the 1990s. The more mechanical a pattern, the more algorithms hunt it, and the more it gets faded or front-run. A textbook engulfing at an obvious level is now sometimes a liquidity trap — the obvious entry is exactly where stops get run before the real move. This isn't a reason to abandon candles. It's a reason to treat them as one input in a confluence stack, never as a standalone oracle, and to respect that the cleanest-looking setups on the most-watched levels are also the most gamed. Keep that skepticism in your chest the whole way through. Now, the patterns.
Single-Bar Patterns: One Candle, One Story

The Doji — indecision, or a coiled spring
A doji has almost no body: open and close are nearly identical, so the candle looks like a cross or a plus sign. It means the period fought to a draw — buyers and sellers ended exactly where they started.
By itself a doji says indecision. But context flips it. A doji after a long uptrend, right into resistance, is buyers running out of gas — a warning. A doji after a hard selloff, at support, is sellers running out of ammo — a potential floor.
The doji family has four members worth naming:
- Standard doji — small wicks both sides, a true balance bar.
- Long-legged doji — long wicks both directions, open and close in the middle. Maximum indecision and maximum volatility inside the bar; big fight, no winner. Often marks the exact bar where a trend hands off.
- Dragonfly doji — long lower wick, open/high/close all clustered up top. A pure bullish rejection; functionally a doji-hammer hybrid. Buyers reclaimed the entire range.
- Gravestone doji — long upper wick, everything down at the bottom. A pure bearish rejection; a doji-shooting-star hybrid.
Same family, opposite messages, told entirely by which side got rejected. Worked example: SPY prints a daily long-legged doji after a five-day rally — open 452.10, high 454.80, low 449.90, close 452.05. Nearly five points of range, essentially zero net body. Buyers pushed to 454.80 and lost it; sellers pushed to 449.90 and lost it. Nobody could close the deal. Into resistance after an extended run, that's a stall worth respecting — not a short trigger by itself, but a "tighten your longs and watch the next bar" flag.
The Hammer — the classic bottom rejection
A hammer has a small body near the top of its range and a long lower wick at least twice the body length, with little or no upper wick. It forms after a decline. The story: sellers pressed price down hard, buyers overwhelmed them, price closed back near the open. Rejection of lower prices. Flip it vertically after an uptrend — small body at the bottom, long upper wick — and it's a hanging man, which warns of a top (same shape, different location, so different meaning).
Real numbers: a stock drops all week and prints a daily hammer — open 148.20, high 148.60, low 144.10, close 147.90. Lower wick ≈ 3.80, body ≈ 0.30. Wick is more than 12x the body. Buyers ate a $4 dip and closed near the highs. If that low tags a support level you'd already drawn, you have something.
There's a stronger cousin worth knowing: the inverted hammer. Small body at the bottom, long upper wick, appearing after a downtrend. It looks like a shooting star but shows up at a bottom instead of a top. The read: buyers tried to push up, got rejected at the highs, but the very attempt after a long decline signals that sellers are losing their grip. It's weaker than a clean hammer and demands a confirming green bar behind it. Location, again, is everything — the identical shape is a hanging man (bearish) at a top and an inverted hammer (bullish tilt) at a bottom.
The Shooting Star — the classic top rejection
A shooting star is the hammer's evil twin: small body near the low, long upper wick, minimal lower wick, forming after an advance. Buyers pushed to new highs, sellers slammed it back, close near the open. Rejection of higher prices. This is your fade-the-pop candle — at resistance. In mid-air it's noise.
Worked example on NQ 15-minute during an uptrend: open 20,180, high 20,232, low 20,176, close 20,184. Upper wick ≈ 48 points, body ≈ 4 points. Buyers tagged 20,232 and got shoved back 48 points to close near where they opened. If 20,225–20,235 is a call wall from the GEX terminal or a prior day high, that shooting star just tagged real overhead supply and got rejected. Now it's a trigger. In the middle of nowhere, it's a bar you scroll past.
The Marubozu — total conviction
A marubozu is all body, no wicks (or nearly none). Open = the extreme low, close = the extreme high (bullish marubozu), or the reverse (bearish). It means one side dominated the entire period start to finish, no rejection anywhere. A bullish marubozu breaking a level is a genuine show of force — buyers never let price tick against them. Respect these more than most people do; they often mark the start of a real move rather than the end.
The subtle skill with a marubozu is knowing whether it's initiation or exhaustion. A marubozu breaking out of a tight consolidation, early in a move, on rising volume, is initiation — get on board or wait for the pullback. A marubozu that's the tenth big green bar in a vertical, over-extended run, on climactic volume, can be the blow-off — the last desperate chase before a reversal. The candle looks identical. The location on the trend, and the volume signature, tell you which one you're holding.
The Spinning Top — small body, wicks both sides
A spinning top has a small body with meaningful wicks on both ends. Buyers and sellers both took swings, both got rejected, nobody closed the deal. Like the doji, it's an indecision bar — valuable as a warning inside a trend (momentum is stalling) but useless as a standalone trade. File it under "pay attention," not "click buy." A cluster of two or three spinning tops after a strong directional run is one of the market's clearest "the move is tired" tells — not a reversal signal, but a momentum-is-leaking signal that says take partials and tighten stops.

Two-Bar Patterns: The Conversation Between Candles
Now candles start talking to each other. Two-bar patterns compare today's auction to yesterday's — and the comparison is where the edge lives.
Engulfing — the momentum flip
A bullish engulfing is two candles: a smaller red (down) candle, then a larger green (up) candle whose body completely engulfs the prior body — it opens at or below the prior close and closes at or above the prior open. In one period, buyers erased an entire period of selling and then some. That's a genuine shift in who's in control.
A bearish engulfing is the mirror: a small green candle swallowed by a large red one. Sellers erased a full period of buying.
The mechanism: engulfing is a momentum handoff. The engulfing body means the new side didn't just win — it won by more than the prior side had gained. Worked example on NQ 15-minute: candle one is red, open 20,040, close 20,025 (15-point down body). Candle two is green, opens 20,022 and closes 20,048 — a 26-point body that fully engulfs the prior 15. Buyers took back the entire prior candle plus 11 extra points. At a support level with rising volume, that's a legitimate long trigger. The stop is obvious: below the low of the engulfing pair. Structure hands you the invalidation for free.
Not all engulfings are equal. Grade them:
- The bigger the engulfing body relative to what it swallows, the stronger. Engulfing two or three prior bodies beats barely engulfing one.
- Where it closes matters. An engulfing that closes at the very top of its range (near-marubozu) is stronger than one that closes with a big upper wick already forming.
- Volume confirms. The engulfing bar should print noticeably higher volume than the bar it swallowed. That's the "real size flipped" proof.
- The level underneath is the multiplier. An engulfing at prior-day-low with rising volume and RSI divergence is an A-plus. The same engulfing mid-range is a C-minus you should skip.
Harami — the pause that precedes the turn
A harami is engulfing in reverse: a large candle followed by a small candle whose body sits entirely inside the prior body. ("Harami" is Japanese for pregnant — the big candle is the mother, the small one the belly.) It signals that a strong move just lost its momentum. A big red down candle followed by a tiny candle inside it (bullish harami) says the selling pressure suddenly evaporated. It's not a reversal yet — it's the stall before one. Weaker signal than engulfing; treat it as "prepare," not "fire."
The special case is the harami cross — where the small second candle is an actual doji. That's the strongest version of the pattern, because it shows momentum didn't just slow, it hit a dead stop. A big red down bar followed by a doji sitting inside it, right at support, is a coiled spring. It still wants confirmation — the third bar closing back into the mother candle — but the harami cross is the two-bar pattern that most often precedes a clean turn.
Piercing Line and Dark Cloud Cover — the halfway reclaim
Piercing line (bullish): a red down candle, then a green candle that opens below the prior low (a gap down) but closes back above the midpoint of the prior red body. Sellers gapped it down, buyers not only recovered the gap but reclaimed more than half of yesterday's loss. Strong, but a notch below a full engulfing because it only reclaims half, not all.
Dark cloud cover is the bearish mirror: a green up candle, then a red candle that opens above the prior high and closes below the midpoint of the prior green body. Note these need a gap to be textbook — which makes them cleaner in stocks (which gap between sessions) than in 24-hour futures, where true gaps are rarer.
Here's the futures-trader's adaptation, because you'll be told "these don't work on NQ." In a 24-hour market you rarely get a clean overnight gap, but you do get the functional equivalent: a sharp down-thrust to open a session followed by an immediate reclaim past the prior bar's midpoint. The order-flow meaning — sellers pressed the open, buyers overwhelmed them and took back most of the prior loss — is identical whether or not there's a visual price gap. Read the behavior, not the textbook gap requirement. The gap is how the pattern was originally defined; the reclaim of the midpoint is what actually carries the signal.
Tweezers — the double rejection
Tweezer bottoms are two (or more) candles with matching lows — price hit the same floor twice and bounced both times. Tweezer tops match highs. The message: a level got tested repeatedly and held. Tweezers are quietly one of the most useful two-bar patterns because they're a candle-level version of a double bottom/top — and they scream "there's resting liquidity here that's being defended." Best when the matched wicks land on a level you've already marked.
Worked example: NQ tests 19,880 on a 5-minute bar, wicks down to it, closes back at 19,905. Three bars later it tests 19,878 again, wicks to almost the identical low, closes back up. Two rejections of the same floor within a tight window. If 19,880 is your marked prior-day low, that tweezer bottom is the market showing you, twice, that size is defending the level. The stop writes itself — a few points below the matched lows — and it's tight, which means your 1:3 target is easy to reach.

Three-Bar Patterns: The Full Reversal Sequence
Three-bar patterns are the most reliable of the candle family because they show a complete transition: the old trend, the moment of indecision, and the new trend — all three phases, confirmed.
Morning Star and Evening Star — the textbook reversal
The morning star (bullish bottom reversal) is three candles:
- A large red down candle — the existing downtrend, in force.
- A small-bodied candle (often a doji or spinning top), ideally gapping down — the moment of exhaustion and indecision.
- A large green up candle that closes well into the body of candle one — buyers seizing control.
Read the arc: heavy selling → stall → decisive buying. That's an entire regime change in three bars. The evening star is the mirror at a top: big green, small indecision candle, big red closing into the first candle's body. When the middle candle is a true doji, it earns its own name — the morning doji star or evening doji star — and it's the strongest form, because the indecision bar showed a complete standstill before the reversal committed.
Worked example. A stock declines for two weeks. Day one of the pattern: large red, close 96.00. Day two: a doji around 95.60 — tiny body, market catching its breath. Day three: large green, opens 95.80, closes 98.40, driving deep into day one's body. Sellers exhausted, buyers committed. If day two's low tapped a level you already had and day three came on above-average volume, this is as clean as candles get. The stop is below the star's low; a 1:3 target is very reachable off a fresh reversal.
The single most important quality check on a star: how deep does the third candle close into the first? A third bar that closes past the midpoint of candle one is a valid star. A third bar that closes past candle one's open — erasing the entire first bar — is a powerhouse, functionally a morning star and an engulfing stacked together. The deeper the reclaim, the more decisively control changed hands.

Three White Soldiers and Three Black Crows — momentum, not reversal
Three white soldiers: three consecutive green candles, each opening within the prior body and closing near its high, each making a higher high. This isn't a reversal pattern — it's a momentum confirmation. Steady, controlled buying with no big upper wicks means demand is absorbing everything. Three black crows is the bearish version: three red candles stair-stepping down, each closing near its low.
Caveat: if the candles are enormous, the move may be over-extended — soldiers can mark the middle of a run or the exhaustion top of one, and only the level tells you which. There's also a warning-sign variant: if each successive soldier has a smaller body and a growing upper wick, that's "stalling soldiers" — the advance is running out of gas even as it makes higher highs. Three green bars that get progressively weaker is a very different message from three green bars that get progressively stronger. Read the trend within the pattern, not just the pattern.
Three Inside and Three Outside — harami and engulfing, confirmed
Three inside up is a harami plus a confirmation bar: big red, small candle inside it, then a third green candle that closes above the first candle's open — the harami proven right. Three outside up is an engulfing plus confirmation: the bullish engulfing pair, then a third green candle closing higher still. These are just the two-bar patterns with a third candle that says "yes, it stuck." The confirmation costs you a slightly later entry and buys you a materially higher win rate. Usually worth it.
The tradeoff is real and worth naming explicitly. Waiting for the third-bar confirmation means you enter higher (on a long) than the trader who fired on the two-bar signal. Your stop-to-entry distance is wider, which shrinks your reward-to-risk on the same target. So the confirmation is not a free lunch — it trades a better win rate for a worse R:R. The right call depends on the setup: in choppy, unreliable conditions, take the confirmation and accept the worse R:R for the higher hit rate. In a strong trend with a clean level, the two-bar signal is often good enough and the extra R is worth the occasional fake. Knowing which environment you're in is the whole game — which is exactly what the next section is about.
Candles Across Market Regimes
The same pattern means different things depending on the weather. This is the layer that separates traders who memorized a PDF from traders who actually read the tape.
In a Strong Trend
In a clean uptrend, the patterns that pay are continuation patterns, not reversals. Hammers and bullish engulfings that form on pullbacks into support — into a rising EMA, into VWAP, into a golden pocket — are gold. They're the trend catching its breath and reloading. Meanwhile, reversal signals against the trend are mostly traps. A single bearish engulfing in a powerful uptrend is usually just a pause before the next leg up, and shorting it is how you get run over. In a strong trend: take the with-trend triggers at pullback levels, ignore the countertrend ones. The trend is the tailwind; trade with it and the wind pushes your candle triggers; trade against it and every trigger fights the current.
In a Range / Chop
In a sideways range, the logic inverts. Now the reversal patterns at the range edges are the moneymakers, and the continuation / breakout patterns are the traps. A shooting star at the top of an established range and a hammer at the bottom are high-percentage fade setups — you're selling resistance and buying support in an environment that keeps respecting both. The killer in a range is the mid-range signal: a beautiful engulfing halfway between the top and bottom of the range means nothing, because there's no level under it and price will just drift to the next edge. In chop: fade the edges, ignore the middle, and distrust breakout bars until they prove themselves with a retest, because ranges are breakout-fake machines.

In High Volatility
When volatility expands — news days, CPI prints, FOMC, earnings — everything gets bigger and messier. Wicks are enormous, bodies are enormous, and stops that were fine yesterday get vaporized on random 40-point spikes. Two adjustments matter. First, weight the close even more heavily, because intrabar the candle will look like six different patterns before it settles; only the close is real. Second, widen your stops and cut your size so a normal volatility wick doesn't take you out of a correct read. A hammer on a high-vol day might have a 60-point lower wick — that's a valid rejection, but your stop has to sit below a 60-point wick, so your position size has to shrink to keep the dollar risk constant. Patterns still work in high vol; they just cost more room to trade.
In Low Volatility / Dead Tape
Overnight sessions, lunch hour, the days between holidays — thin tape. Here patterns misfire constantly because a single order can create a "pattern" that reflects one participant, not a crowd. A hammer on 200 contracts at 2 p.m. lunch is not the market defending a level; it's one algorithm and a rebate. In dead tape, demand much heavier volume confirmation or simply stand down. The best traders take fewer trades in thin conditions, not the same number with worse odds.
Multi-Timeframe: The Same Candle on Five Charts
A candle never exists alone — it's simultaneously part of a 1-minute chart, a 5-minute, a 15, an hourly, and a daily. The art is aligning them.
The core principle is higher timeframe sets the bias, lower timeframe sets the trigger. You do not take a 1-minute bullish engulfing just because it's pretty. You take it when the daily and hourly say "up," the 15-minute pulled back into a level, and then the 1-minute engulfing fires as your precise entry inside a bias you already established from above.
Think of it as nested confessions. The daily says who's winning the war. The hourly says who's winning the current battle. The 5- and 1-minute say who's winning the current skirmish. You want all three pointing the same way, and you use the fastest chart only to time the entry — never to set the direction.
There's also a fractal relationship worth seeing: a single daily hammer, when you drop down to the 5-minute chart of that same day, often is a morning star or a tweezer bottom or an intraday double bottom. The big candle's long lower wick is, up close, an entire sequence of selling, stalling, and reclaiming. This is why "read the structure, not the single candle" and "align your timeframes" are the same rule viewed from two angles. The daily hammer and the 5-minute morning star are the same confession recorded at two zoom levels.

Practical multi-timeframe workflow:
- Daily: set bias with the EMA stack (more on this below). This is your permission slip — long, short, or stand down.
- Hourly / 15-minute: find the level price is approaching that agrees with your bias. Draw it.
- 5- / 1-minute: wait for the candle trigger at that level, in your bias direction.
- Execute on the fast chart, manage with the slow chart. Your stop lives below the fast-chart pattern; your target is a slow-chart level.
The mistake beginners make is treating a 1-minute engulfing and a daily engulfing as equally important. They are not remotely equal. A daily engulfing outranks a 1-minute engulfing by a mile, because it represents an entire day's worth of committed capital flipping, versus sixty seconds of it. Weight every signal by the timeframe that produced it.
The HPT Rule: A Doji Inside a Flag IS the Flag
Here's the rule that separates traders who use candlesticks from people who collect them.
Do not read single candles in isolation. Read the structure they're building.
A doji is "indecision" — supposedly a warning. But a doji that prints inside a bull flag (a tight, orderly pullback after a strong up-move) is not indecision. It is the flag. It's price consolidating, coiling, resting before continuation. Selling a doji there because a cheat sheet said "indecision = caution" is how you short the strongest continuation setups on the board.
The individual candle is a letter. The structure is the sentence. "R-U-N" is three letters; you don't stop to interpret the R. A doji inside a flag, a hammer as the second tap of a tweezer bottom, a shooting star as the right shoulder of a head-and-shoulders — the candle is a character in a larger word, and the word overrides the letter every time.

Some structures that override the single-candle reading:
- A doji or spinning top inside a bull/bear flag → continuation, not indecision.
- A hammer that's also the second tap of a tweezer bottom at prior-day-low → a triple-stacked bottom signal, not a lone hammer.
- A shooting star forming the right shoulder of a head-and-shoulders top → a structural short, not a random pop-fade.
- An engulfing that also reclaims a broken level (a failed breakdown) → a "failed move = fast move" reversal, far stronger than the engulfing alone.
- Three black crows that are actually the measured breakdown of a range → a trend initiation, not just three red bars.
This is timeframe-weighted confluence, HPT-style: the higher-timeframe structure sets the bias, and the lower-timeframe candle is your trigger inside that bias — never a standalone reason to trade. A bullish engulfing on the 5-minute means one thing when the daily trend (EMA 12/22/55 stacked and rising, the 55 pointing up) agrees, and something much flimsier when the daily 55 is falling and you're fighting the tape. The daily 55-EMA is the bias tell. Trade candles in its direction and they're triggers; trade them against it and they're bait.
Confluence: Stacking Candles With Other Tools
A candle is one witness. A conviction needs corroboration. Here's how candles combine with the three tools that most improve them.
Candles + Fibonacci (the Golden Pocket)
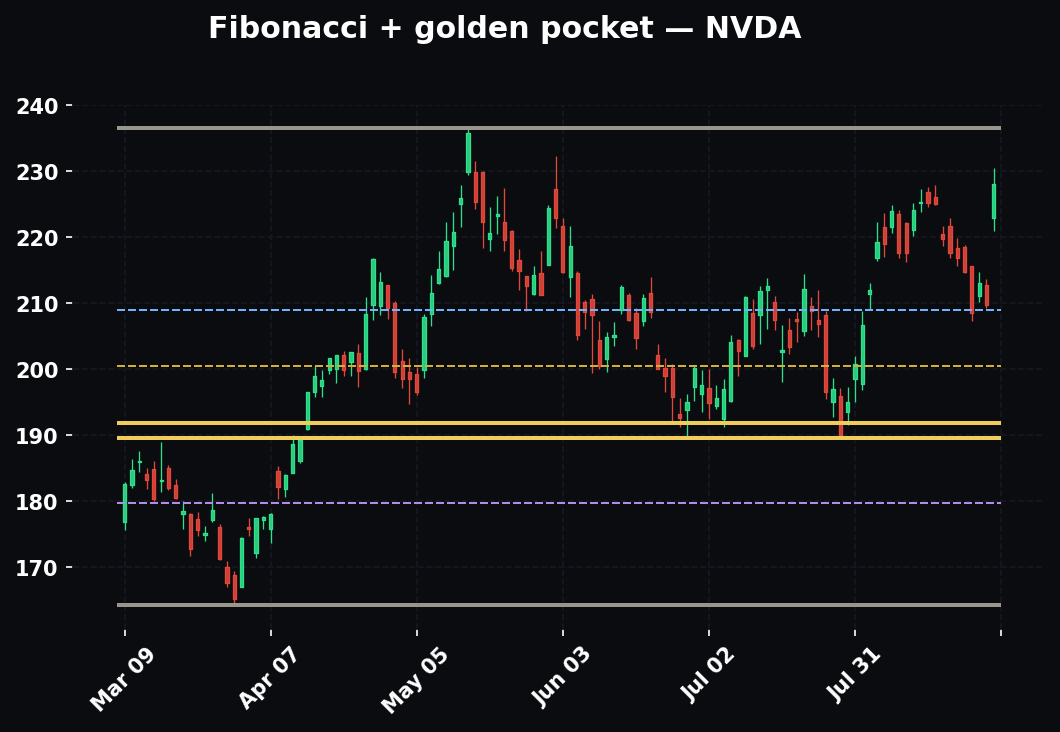
The golden pocket is the 0.618–0.65 retracement zone of a measured leg — the area where healthy pullbacks in a trend most often find their floor. Draw a fib from the swing low to the swing high of an up-leg; the 0.618–0.65 band is where you want to see a bullish candle trigger appear.
Worked sequence: NQ rallies from 19,800 to 20,100 (a 300-point leg). The golden pocket sits at roughly 19,915–19,905 (the 0.618–0.65 zone of that leg). Price pulls back, and at 19,910 it prints a hammer with a long lower wick and a green close. Now you have three things agreeing: the trend is up (bias), the pullback landed exactly in the golden pocket (level), and the candle rejected lower prices (trigger). That's a textbook with-trend long. Your stop goes below the pocket and the hammer's low (say 19,890); your target is a retest of the highs and beyond, easily 1:3 or better. The candle alone was a maybe. The candle in the pocket is a trade.

Candles + Volume
Volume is the participation meter. A reversal candle on above-average volume means real size flipped; the same candle on dead volume is a rumor. The specific confluence to hunt: a climax volume spike on a reversal candle at a level. When a hammer at support prints on two or three times the average volume, that's capitulation into demand — sellers puked their last shares right into the buyers who were waiting. It's the highest-conviction version of a bottom. Conversely, a breakout bar on below-average volume is a red flag — nobody's participating, and it will likely fail and reverse. Always ask the candle: "did anyone show up?"
Candles + RSI Divergence
RSI divergence is the momentum tell that front-runs reversals. Bullish divergence: price makes a lower low, but RSI makes a higher low — the second selloff had less momentum than the first, even though it went lower. When a hammer or morning star forms on that bullish divergence at support, you have the trend of momentum turning up before price confirms it, plus a candle trigger to time the entry, plus a level to lean on. That's a three-tool stack: level + candle + divergence. Bearish divergence (price higher high, RSI lower high) pairs the same way with shooting stars and evening stars at resistance.
The math of confluence is simple and brutal: any one of these signals alone is a coin flip; two together is an edge; three-plus is a trade you press. But — and this is the discipline — manufactured confluence is worse than none. Forcing four weak, unrelated signals to "agree" so you can justify a trade you already wanted is how you blow up. If it's weak, call it weak and pass.
How the Pros Use It Differently From Beginners
The gap between a beginner and a professional isn't knowledge of more patterns. The pro often uses fewer patterns than the beginner. The difference is entirely in how they're used.
Beginners scan for shapes. Pros scan for levels, then check for shapes. A beginner flips through charts hunting for a hammer. A pro marks their levels first and only cares whether a candle trigger appears when price arrives at one. The beginner's process generates dozens of low-quality "signals" a day; the pro's process generates two or three high-quality ones and passes on everything else.
Beginners want the pattern to predict. Pros want the pattern to confirm. A beginner treats a bullish engulfing as a crystal ball that says "up next." A pro treats it as one witness corroborating a thesis they already built from trend, level, and context. The candle doesn't create the trade; it triggers a trade the pro was already stalking.
Beginners take every instance. Pros grade every instance. To a beginner, an engulfing is an engulfing. A pro instantly grades it: How big is the engulfing body? Where did it close in its range? What's the volume? What level is under it? Which way is the daily 55? A pro's engulfing at prior-day-low with volume and divergence is a completely different animal from a pro's mid-range engulfing on dead tape — which they don't take at all.
Beginners fear missing the move. Pros fear taking the wrong move. The beginner sees a candle and rushes in afraid the train's leaving. The pro knows there's another train every fifteen minutes and would rather miss ten trades than take one with bad location. Patience at the level is the entire edge, and it's the hardest thing to teach because it feels like doing nothing.
Beginners exit on emotion. Pros exit on structure. When a pro's structural stop breaks — price closes below the low of the pattern — the pattern is dead and they're out, no debate. The beginner "gives it room," moves the stop, marries the pattern, and turns a small planned loss into a large unplanned one. The pro's stop was defined by the candle before they ever entered.
Beginners think the pattern is the strategy. Pros know the pattern is one input. The candle is the last box that gets checked in a stack of bias, level, volume, and momentum. To a pro, "I saw a hammer" is not a reason to trade. "I had a long bias, price pulled into the golden pocket at prior-day-low on bullish RSI divergence, and then a hammer confirmed it" is a reason to trade. Same hammer. Entirely different level of conviction.
How to Actually Use It: The Playbook
Monday morning, in order:
1. Mark the levels first — before you look at a single candle. Support, resistance, prior day high/low, the golden pocket, VWAP, round numbers. The levels do the work. This step is non-negotiable and it comes first, so you're never talked into a mid-range candle.
2. Set the bias with the daily EMAs. 12/22/55 stacked up and the 55 rising = long bias. Stacked down, 55 falling = short bias. Tangled = no-bias, stand down or scalp only. This decides which candle triggers you're even allowed to take.
3. Wait for price to reach a level. No level, no setup. Patience here is the whole edge.
4. Read the candle at the level — as structure, not a shape.* Is this a hammer as the second tap of a tweezer bottom? An engulfing at prior day low? A doji that's actually a flag mid-trend? Name the word, not just the letter.
5. Demand confluence before you fire. Level + pattern + volume + trend agreement + (bonus) RSI divergence or a reclaim of VWAP. Two of these is thin; three-plus is a trade. Manufactured confluence — forcing four weak signals to agree — is worse than none. If it's weak, call it weak and pass.
6. Let structure set your stop. Below the low of the hammer / engulfing pair / star. The pattern hands you the exact invalidation — that's the gift of trading candles at levels.
7. Size for 1:3 minimum. Stop is defined by the candle low; project a target at least three times that risk toward the next real level. If 1:3 doesn't fit before you hit resistance, it's not your trade. This single rule means you can be right 40% of the time and still print.
8. Take the trade or take the pass — and log it either way. Discipline banks it. The levels find the trade; your rules keep you in the ones that pay.
A Full Worked Trade, Start to Finish
Let's run one complete example so the process is concrete.
It's Monday. On the daily NQ chart, EMA 12/22/55 are stacked bullish and the 55 is rising — bias: long. You mark levels: prior day low at 19,940, the golden pocket of last week's up-leg at 19,915–19,905, and a round number at 19,900. Notice they cluster — three reasons to care about the 19,900–19,940 zone. That's a confluence zone, the best kind of level.
Price opens strong, then pulls back through the morning. By 10:30 it's grinding down into 19,930. You do nothing but watch — no level tagged with a trigger yet. At 10:50 a 5-minute bar wicks all the way to 19,908 (right into the golden pocket and the round number) and closes back at 19,942. Long lower wick, small green body near the top — a hammer, and its low sits in your confluence zone. Volume on that bar is roughly 2x the prior ten bars. You check RSI on the 5-minute: price made a lower low into 19,908 but RSI made a higher low — bullish divergence.
Count the stack: bias (long, daily EMAs) ✓, level (golden pocket + prior day low + round number) ✓, pattern (hammer at the level) ✓, volume (2x, participation) ✓, divergence (bullish RSI) ✓. That's five, not two. You fire.
Entry: 19,945 on the close of the hammer (or the break of its high). Stop: below the hammer low and the zone, 19,895 — a 50-point risk. Target: 1:3 means 150 points, to 20,095, which is below the prior swing high at 20,100, so the target fits before you hit real resistance. Trade taken. If price closes back below 19,895, the pattern is dead and you're out for a defined 50-point loss. If it works, you make 150. Right 40% of the time on that math, you print. The level found the trade; the confluence graded it; the structure set the stop; the 1:3 made it worth taking.
Common Mistakes (Read This Part Twice)
1. Trading the shape, ignoring the location. The cardinal sin. A pattern mid-range is not a pattern; it's a coin flip with a costume on. Every other mistake on this list is downstream of this one. If you fix nothing else, mark your levels first and refuse to trade candles that aren't sitting on one.
2. Reading single candles in isolation. Shorting a doji that's actually a bull flag. Reading the letter, missing the word. The candle is a character inside a structure, and the structure — flag, tweezer, head-and-shoulders, failed breakout — overrides the character every time.
3. Forcing patterns that aren't there. If you're squinting, it's not a pattern — it's hope. A real engulfing doesn't need you to tilt your head. When you find yourself arguing with the chart to make a shape appear, the honest read is "no setup," and the honest action is to pass.
4. Ignoring volume. A reversal without participation is a rumor. The prettiest hammer at the prettiest level, printed on dead volume, is one participant, not a crowd — and one participant doesn't defend a level. Always ask: did anyone actually show up?
5. Fighting the higher-timeframe trend on a lone candle. One engulfing does not stop a daily downtrend. Countertrend candle patterns have low odds; the freight train wins. If you must fade a strong trend, treat it as a small-size scalp with a tight leash, never as a full-conviction reversal trade.
6. No confirmation on weak patterns. Haramis and single dojis deserve a confirmation bar. Waiting costs a few ticks and buys a much better win rate. The trader who fires on every unconfirmed harami collects a lot of small losses that a one-bar wait would have filtered out.
7. Same pattern, every timeframe, treated equally. A daily engulfing outranks a 1-minute engulfing by a mile. Weight by timeframe. Treating a 60-second signal with the same respect as a full-day signal is how you get chopped to death on the fast charts.
8. Marrying the pattern after it fails. When price closes below your structural stop, the pattern is dead. Get out. A failed pattern you refuse to exit is no longer a candlestick lesson — it's a risk-management failure. The stop was your one moment of clarity; honor it.
9. Entering intrabar before the candle closes. The confession isn't signed until the close. A hammer that looks perfect two minutes into a five-minute bar can close as a bearish engulfing. Jumping in before the close means you're trading a pattern that doesn't exist yet. Wait for the pen to leave the paper.
10. Over-trading in dead or thin tape. Lunch hour, overnight, holiday weeks — patterns misfire because there's no crowd behind them. The urge to trade doesn't care that the odds got worse. The pros take fewer trades when the tape thins; amateurs take the same number and wonder why their win rate collapsed.
11. Manufacturing confluence. Forcing four weak, unrelated signals to "agree" so you can justify a trade you already wanted. Real confluence is independent tools pointing the same way by coincidence of the setup; manufactured confluence is you torturing the chart until it confesses to a crime it didn't commit. If it's weak, call it weak.
12. Anchoring to the pattern instead of the plan. The candle is the trigger, not the plan. The plan is bias + level + stop + target + size. Traders who fall in love with a beautiful candle forget they need somewhere for it to go (the target) and somewhere for it to be wrong (the stop). A gorgeous engulfing with no room to a 1:3 target is not your trade, no matter how good it looks.
Frequently Asked Questions
Do candlestick patterns actually work, or are they superstition? They work as descriptions of order flow, not as standalone predictions. A hammer at a defended level on volume genuinely tells you buyers absorbed selling and are likely still there. A hammer in mid-range on dead volume tells you almost nothing. The pattern's edge is entirely conditional on location, volume, trend, and confluence. Used as an oracle, they're superstition. Used as one confirming input in a stack, they're a real edge.
What's the single most important candle pattern to learn first? The engulfing, because it's the clearest visual of a momentum handoff and it hands you an obvious structural stop. But more important than any pattern is the hammer/shooting-star family, because they teach you to read wicks — and reading wicks (rejection) is the core skill that makes every other pattern legible.
Do these work on crypto / forex / futures the same as stocks? Mostly yes, with one adjustment: the gap-dependent patterns (piercing line, dark cloud cover) are cleaner in stocks because stocks gap between sessions. In 24-hour markets like crypto and futures, read the behavior those patterns describe (a sharp thrust reclaimed past the prior midpoint) rather than requiring a literal price gap. The order-flow logic is universal; only the gap mechanics are market-specific.
What timeframe should I trade candles on? Whatever fits your holding period — but always use at least two timeframes: a higher one for bias and a lower one for the trigger. Day traders often use daily/hourly for bias and 5-/1-minute for entry. Swing traders use weekly/daily for bias and 4-hour/hourly for entry. Never trade a single timeframe in isolation; a candle without a higher-timeframe context is a letter with no word.
How many candles make a valid pattern — do I always need the full three-bar sequence? No. Single-bar (hammer, shooting star), two-bar (engulfing, tweezer), and three-bar (star) patterns are all valid; the three-bar versions are simply more reliable because they show a complete transition, at the cost of a later entry. Match the pattern to the environment: in reliable trends, faster signals are fine; in chop, demand the confirmation.
Should I wait for the candle to close before entering? Almost always yes. Intrabar, a candle can morph through several patterns before it settles. The close is the vote that counts. The rare exception is when you're entering on a break of the prior bar's level as your trigger (e.g., a stop-buy above a hammer's high), which is a different, valid entry method — but even then you're reacting to a completed prior bar, not guessing at an unfinished one.
Why did my "perfect" pattern fail? Almost always one of three reasons: it was mid-range (no level under it), it was against the higher-timeframe trend, or it printed on dead volume. Check those three first. If the pattern had a level, agreed with the trend, and had volume, then it was simply a losing trade in a probabilistic game — which is normal, and why the 1:3 R/R and the stop exist. Even A-plus setups lose sometimes; that's what risk management is for.
How do I tell a real reversal from a dead-cat bounce? Location and follow-through. A reversal at a real level, on volume, with a higher-timeframe bias shift (the daily 55-EMA starting to turn), and confirmation on the next bar, is a candidate reversal. A bounce with no level, no volume, against a still-falling daily trend, that stalls immediately, is a dead cat. When in doubt, the 55-EMA slope is your tiebreaker — reversals that fight a hard-sloping 55 usually fail.
Quick-Reference Cheat-Sheet
Anatomy: Body = open-to-close (settled outcome). Wick = rejected territory. Long lower wick = bullish (low prices rejected). Long upper wick = bearish (high prices rejected). Close = the vote that counts. Body-to-range ratio near 1 = conviction; under 0.3 = rejection/indecision. Size is always relative to recent bars. Read the wick, not just the color.
Single-bar:
- Doji — indecision / potential turn at a level; context decides. Long-legged = max indecision; dragonfly = bullish; gravestone = bearish.
- Hammer — long lower wick after a drop → bottom rejection. Hanging man = same shape after a rally → top warning. Inverted hammer = long upper wick after a drop → weaker bottom tilt, needs confirmation.
- Shooting star — long upper wick after a rally → top rejection.
- Marubozu — all body, no wick → total conviction. Initiation (early, on volume) vs. exhaustion (late, climactic) — location decides.
- Spinning top — small body, both wicks → indecision, a warning not a trade. Clusters = momentum leaking.
Two-bar:
- Bullish/bearish engulfing — big body swallows the prior → momentum flip. Strongest two-bar signal. Grade by engulfing size, close location, volume, and the level under it.
- Harami — small body inside a big one → momentum stall; wait for confirmation. Harami cross (doji inside) = strongest version.
- Piercing / dark cloud — gap, then reclaim past the midpoint → half-strength reversal. In futures, read the behavior, not the literal gap.
- Tweezers — matched lows/highs → level defended twice; a mini double top/bottom.
Three-bar:
- Morning / evening star — trend, indecision, reversal → the textbook full reversal. Deeper the third-bar reclaim, the stronger. Doji-star variant = strongest.
- Three soldiers / crows — three stair-steps → momentum confirmation. Watch for shrinking bodies / growing wicks = stalling.
- Three inside up/down — harami + confirmation.
- Three outside up/down — engulfing + confirmation.
Regime cheat:
- Trend: take with-trend continuation triggers at pullback levels; ignore countertrend reversals.
- Range: fade reversal triggers at the edges; distrust mid-range and breakout bars.
- High vol: weight the close, widen stops, cut size.
- Thin tape: demand heavy volume or stand down.
Confluence stack (grade the setup):
- Level (support/resistance/PDH-PDL/golden pocket/VWAP/round number)
- + Pattern (read as structure, not shape)
- + Volume (participation; climax = capitulation)
- + Trend agreement (daily EMA 12/22/55, 55 = bias tell)
- + Bonus: RSI divergence, VWAP reclaim
- One = bait. Two = thin. Three-plus = a trade. Manufactured = worse than none.
The rules that keep you alive:
- Levels first, always. No level = no trade.
- Daily 55-EMA sets the bias; candles are triggers inside it.
- Higher timeframe = bias; lower timeframe = trigger. Weight signals by timeframe.
- Wait for the close. The confession isn't signed until the pen leaves the paper.
- Structure sets the stop (below the pattern low). 1:3 R/R minimum, or no trade.
- Read the word, not the letter. A doji inside a flag IS the flag.
- When the structural stop breaks, the pattern is dead. Get out.
The patterns don't predict the future. They tell you who just won the auction and whether they've got backup at a level that matters. That's not fortune-telling — that's reading the tape. Mark your levels, set your bias, wait for the candle to speak at a line that counts, demand your confluence, weight it by timeframe, and let your stop and your 1:3 do the rest.
The levels do the work. Discipline banks it.
Bound by rules, feared by trade.