
Every chart you've ever seen has a moving average on it, and almost nobody uses them right. They get slapped on, glanced at, and ignored the moment price does something scary. That's a waste, because a moving average is one of the few tools that does three jobs at once: it tells you the trend, it hands you dynamic support and resistance, and — when you stack a few of them — it gives you a real-time read on who's winning, buyers or sellers, on any timeframe you choose.
Most traders treat the moving average like a decoration. They add it because a YouTube video told them to, they watch price cross it, they lose money on the cross, and they conclude "moving averages don't work." What actually happened is they used a trend tool in a range, ignored the slope, ignored the timeframe, and traded a signal that was never a signal. The average did its job perfectly. The trader read it wrong.
This is the deep guide. By the end you'll know exactly what each type of average is, why the EMA reacts faster than the SMA (with the actual math, made painless), which sets to use for scalping versus swinging versus position trading, how to read stacks and crosses and ribbons, how the same three lines behave completely differently in a trend versus chop versus a high-volatility blowout, how to stack timeframes so they confirm instead of contradict, and how the pros pull decisions out of these lines that beginners never see. We finish with a FAQ and a cheat-sheet you can pin above your desk.
Let's build it from the ground up.
What a Moving Average Actually Is
A moving average (MA) is the average price of an asset over the last N bars, recalculated on every new bar. That's it. If you take the closing price of the last 20 candles, add them up, divide by 20, you get the 20-period simple moving average for that bar. Next bar, you drop the oldest close, add the newest, and recompute. The number "moves" forward in time — hence the name.
Why bother? Because raw price is noisy. A single candle can spike on one panicked order and mean nothing. The average smooths that noise into a trend — the underlying direction once you strip out the jitter. The MA is a lens that trades detail for clarity. The shorter the lookback (the smaller N), the more detail you keep and the twitchier the line. The longer the lookback, the smoother and slower it gets.

The Two Knobs You Must Never Confuse
Two terms before we go further, because you'll see them constantly, and confusing them is the single most common rookie error:
- Period / length: the number of bars the average looks back over. A "20 EMA" uses the last 20 bars.
- Timeframe: the size of each bar. A 20 EMA on the 5-minute chart and a 20 EMA on the daily are completely different animals even though both use "20." Length and timeframe are independent knobs.
Think of it this way. Length controls how much you smooth. Timeframe controls how much time each data point represents. A 20 EMA on a 1-minute chart smooths the last twenty minutes. A 20 EMA on a daily chart smooths the last twenty trading days — a month of price action. The line looks similar on both screens, but one is describing the mood of the last half hour and the other is describing the mood of the last month. Trade them as if they mean the same thing and you will get run over.
What the Line Is Really Measuring
There's a deeper way to hold this. A moving average is a running answer to the question: "What has the market agreed this thing is worth, recently?" When price is above a rising average, buyers have been paying up — the recent consensus of value is climbing, and today's buyers are willing to pay more than the average participant did over the lookback window. When price is below a falling average, the opposite. The average is a memory of consensus, and price's position relative to it tells you whether the current crowd is more aggressive or more timid than the recent crowd. Everything else in this guide is just a refinement of that one idea.
The Three Averages: SMA vs EMA vs WMA/Hull
All moving averages answer the same question — "what's the average price lately?" — but they weight the bars differently. Weighting is the whole game.
Simple Moving Average (SMA)
The SMA gives every bar in the window the exact same weight. In a 20 SMA, the close from 20 bars ago counts precisely as much as the close from this bar. You sum the closes and divide by the count.
That equal weighting is the SMA's strength and its curse. It's smooth and stable — great for defining big, slow trends and for the levels institutions actually watch (more on the 200 SMA later). But it's slow to react. Because a 20-bar-old price still carries full weight, the SMA keeps "remembering" old prices long after the market has moved on. Worse, the SMA has a hidden quirk called the drop-off effect: the line can move purely because of what's leaving the back of the window, even if today's price does nothing dramatic.
Let's make the drop-off effect concrete because most traders have never actually seen it. Imagine a 10 SMA. Nine days ago the stock printed a wild $130 spike; every day since it has hovered flat around $100. Today price closes at $100 again — a totally uneventful bar. But tomorrow, that $130 spike rolls out the back of the 10-bar window and gets replaced by another ~$100 close. The SMA drops noticeably, not because anything happened today, but because a ghost from nine bars ago finally left the room. Your average just moved on old news. Traders who don't understand this see the SMA "break down" and panic-sell into nothing. The EMA does not have this failure mode, which is one of several reasons trend traders prefer it.
Exponential Moving Average (EMA)
The EMA fixes the lag by weighting recent bars more heavily and letting older bars fade smoothly toward zero influence — but never fully dropping them. Instead of a hard window, the EMA uses a smoothing multiplier:
multiplier = 2 ÷ (period + 1)
For a 20 EMA that's 2 ÷ 21 = 0.0952, roughly 9.5%. Each new bar is computed as:
EMAtoday = (Closetoday × 0.0952) + (EMA_yesterday × 0.9048)
Read that carefully, because it's the mechanism the whole industry runs on. Today's close gets about 9.5% of the vote. The other 90.5% is yesterday's EMA — which itself already baked in its yesterday, and so on back through time. The influence of any given bar decays exponentially the further back it sits. Recent price moves the line more; ancient price barely whispers.
That's why the EMA reacts faster than the SMA. It's not magic and it's not a different data source. It's the same closes, weighted so the freshest information dominates. When price turns, the EMA turns with it sooner because the bars doing the turning are the ones carrying the most weight. The SMA is still dragging around a full-weight memory of last week.
Shorter periods have a bigger multiplier (a 9 EMA uses 2÷10 = 0.20, so today's close gets 20% of the vote) and react faster still. Longer periods have a tiny multiplier (a 200 EMA uses 2÷201 ≈ 0.00995, under 1%) and crawl.
Here's a mental model that sticks: the EMA is a person who mostly remembers what just happened and only vaguely recalls the distant past — a normal, healthy memory. The SMA is a person with a perfect but rigid memory of exactly the last 20 days and total amnesia about day 21. The EMA's memory is more human, and markets, being made of humans, tend to respect it.
Weighted Moving Average (WMA)
The WMA is the EMA's blunter cousin. Instead of exponential decay, it assigns linear weights: in a 5-period WMA the most recent bar is multiplied by 5, the next by 4, then 3, 2, 1, and you divide by the sum of the weights (15). More recent = more weight, but the decay is a straight line and older bars get cut off hard at the edge of the window. WMA reacts a touch faster than EMA in some conditions but is choppier. Most traders skip it and go straight to EMA. It's worth knowing because it's the building block of the next one.
Hull Moving Average (HMA)
The Hull MA, built by Alan Hull, is a clever stack of weighted averages designed to kill lag almost entirely while staying smooth. The recipe: take a WMA of half your period, double it, subtract a full-period WMA, then smooth the result with a WMA of the square root of the period. The output hugs price shockingly closely and turns fast — beautiful for seeing trend changes early on a clean chart.
The trade-off: that responsiveness means more whipsaw in chop, and because it can overshoot, the HMA is a poor choice for the precise support/resistance bounces the EMA is prized for. Use Hull as a fast trend-direction signal (many traders color it green when rising, red when falling), not as a level.
The Lag-Versus-Smoothness Trade You Can Never Escape
Step back and see the pattern across all four. Every moving average is a dial between two things you both want and can't fully have at once: responsiveness (turns fast, little lag, catches moves early) and smoothness (ignores noise, few false signals, stable levels). SMA maximizes smoothness at the cost of lag. Hull maximizes responsiveness at the cost of stability. EMA sits in the sweet spot, and WMA sits just past it toward twitchy. There is no setting that gives you a line that turns instantly and never whipsaws — if a vendor sells you one, it's curve-fit to the past and will fail live. Understanding that this trade-off is fundamental, not a flaw to be engineered away, is what separates traders who use these tools from traders who keep hunting for the "best" one.
The verdict for most traders: EMA for reading trend and for dynamic levels; SMA when you specifically want the slow, institution-watched line (200 SMA); Hull as a fast visual trend filter if you like it. From here, this guide is EMA-first, because that's the HPT engine.
The Popular Sets — and What Each One Is Actually For
An EMA on its own is a line. EMAs in sets become a system. Here are the workhorses, from fastest to slowest.
9 / 21 — Scalp & Momentum
The 9 and 21 EMA pairing is the intraday momentum trader's bread and butter. On a 1- to 5-minute chart, price riding above a rising 9 that's above a rising 21 means momentum is with the bulls and pullbacks to the 9 are buy-the-dip opportunities. The 9 is your trigger, the 21 is your "am I still in the trend" line. When the 9 crosses back under the 21, the momentum leg is likely done. Fast, twitchy, and only trustworthy when something is actually moving — useless in a flat tape.
The tell that a 9/21 momentum leg is healthy: price pulls back to the 9, touches or slightly wicks it, and pushes off without ever closing below the 21. As long as the 21 holds on a closing basis, the leg is intact. The first candle that closes decisively under the 21 is your "leg is over, stop adding, protect profit" flag — not necessarily a reversal, but the momentum phase you were riding has cooled.

The HPT 12 / 22 / 55 — Trend, and the 55 as Bias Tell
This is our framework, so pay attention. HPT defines trend with the 12, 22, and 55 EMA — not the retail-standard 9/21. The 12 is momentum, the 22 is the intermediate trend, and the 55 is the line that decides bias.
The rule that matters most: on the daily, price relative to the 55 EMA is the bias tell. Daily close above a rising 55 and you are looking for longs, full stop — you can scalp counter-trend intraday, but your bias is up and your size and conviction go with the 55. Daily below a falling 55 and the whole book flips: you're hunting shorts and treating rallies as gifts to sell. The 12 and 22 tell you the near-term texture; the 55 tells you which direction the wind is blowing. When all three line up — 12 over 22 over 55, all rising — that's a clean, weighted trend and the highest-conviction environment there is.
Why 12/22/55 instead of 9/21/50? Slightly slower fast lines cut whipsaw on the momentum reads, and 55 (a Fibonacci number) sits far enough out to filter noise while still reacting inside a real trend. The exact numbers matter less than using them consistently — an EMA level only "works" because enough eyes and algos respect it, and consistency is what makes your levels reliable to you.
There's a hierarchy of authority baked into these three lines, and holding it explicitly changes how you trade. The 12 is tactics — it tells you the mood of the last few bars and where a scalp trails to. The 22 is the trade — it's the line the current swing leans on; lose it and the swing you're in is in question. The 55 is the regime — it doesn't care about your trade, it cares about which side of the market you should even be shopping on. Beginners give all three lines equal weight and get confused when they disagree. Pros know the 55 outranks the 22 outranks the 12, and when they conflict, the slower line wins the argument about bias while the faster line wins the argument about timing.
20 / 50 — Swing
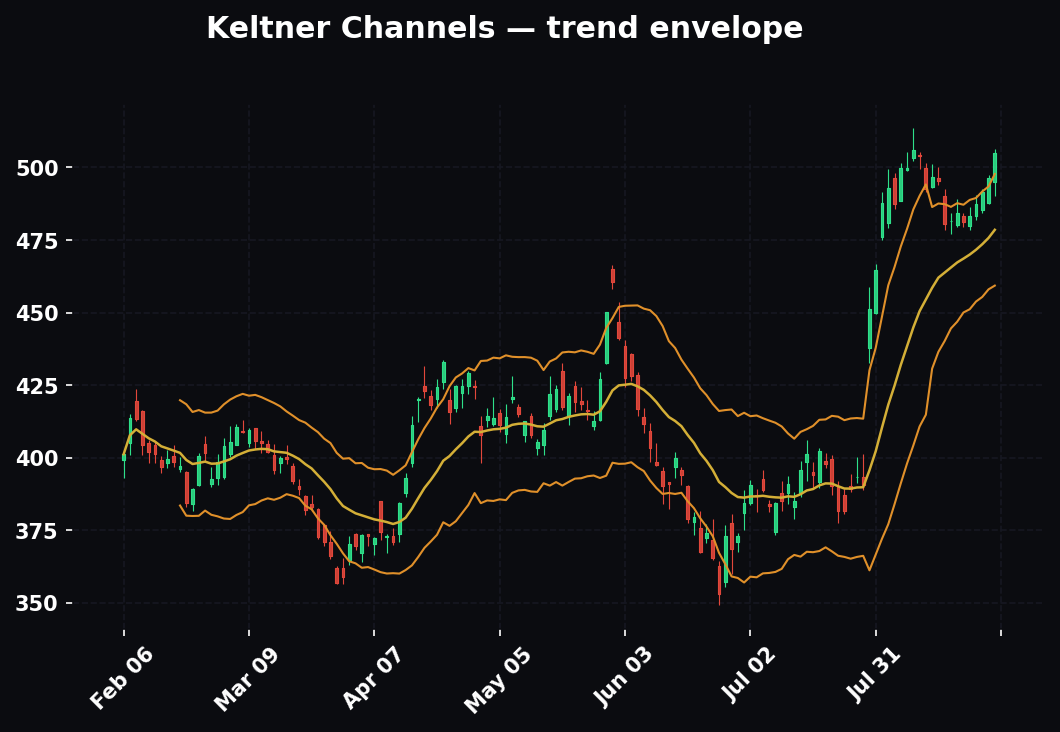
The 20 and 50 EMA are the swing trader's frame on the 1-hour, 4-hour, and daily. The 20 tracks the active swing; the 50 is the trend-of-trends. In a healthy uptrend price pulls back to the 20, and only a deeper flush reaches the 50 — which is where dip-buyers with patience wait. Losing the 50 on a closing basis is a genuine warning that the swing is breaking. Many desks watch the 50 SMA specifically here because it's a widely-published number.
A subtle but valuable habit: on the swing frame, watch which line price pulls back to, because it grades the strength of the trend for you. A trend so strong price keeps bouncing off the 20 and never reaches the 50 is a runaway you should be riding aggressively. A trend where every pullback digs all the way to the 50 before bouncing is tired — still up, but the dip-buyers are getting nervous and demanding a better price. When pullbacks start closing through the 50, the swing trend is transitioning, and you downshift from "buy the dip" to "sell the rip" caution.
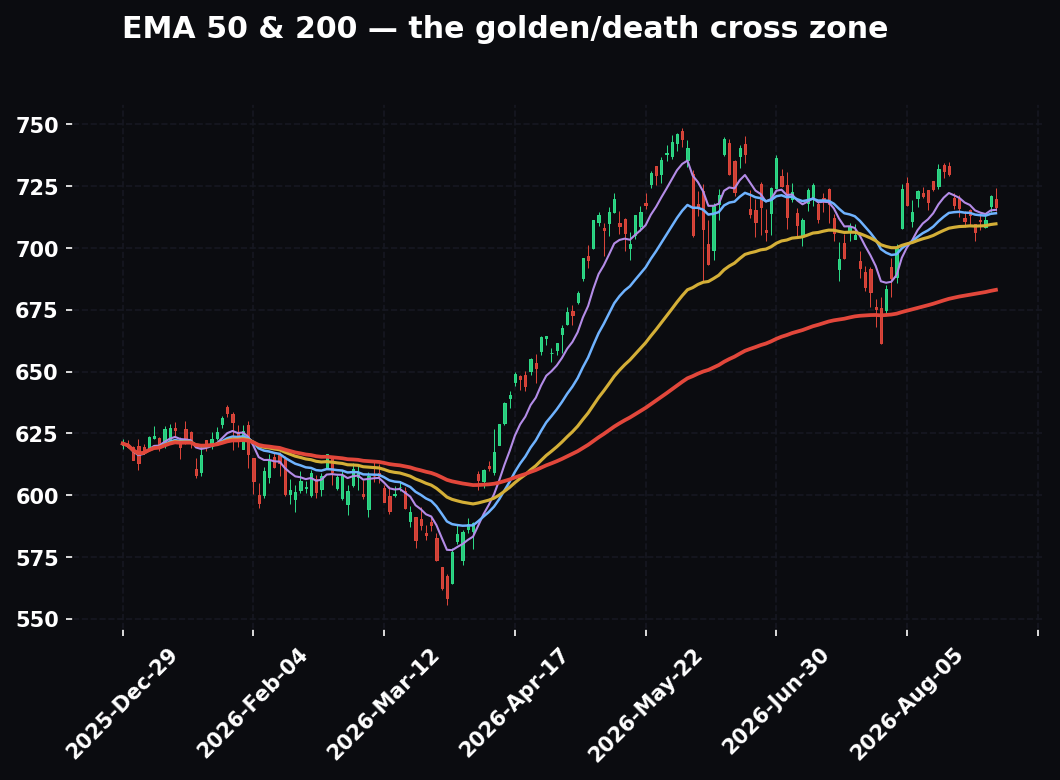
50 / 200 — The Institutional Trend & the Golden/Death Cross
The 50 and 200 (usually SMA at this scale) define the long-term, institutional view. The relationship between them produces the two most-quoted signals in all of technical analysis:
- Golden Cross: the 50 crosses above the 200. Read as a major shift into a bull regime.
- Death Cross: the 50 crosses below the 200. Read as a shift into a bear regime.
These are slow, structural signals — they confirm a regime that's usually well underway, not a precise entry. Their real value is as a filter: above a rising 200, you lean long; below a falling 200, you lean short. Price reclaiming or losing the 200-day is one of the most-watched events on Wall Street precisely because everyone is looking at the same line.
Understand what the golden and death cross actually are and you'll stop mistiming them. They are confirmation, not prediction. By the time the 50 crosses the 200, price has already made a large move — the cross is the two slow averages finally catching up to a change that happened weeks ago. This is why "buy the golden cross" as a mechanical entry often buys the top of the first leg and gets shaken out. The professional use is entirely different: the cross tells you the regime you should be operating in, and you use your faster tools (12/22/55, structure, pullbacks) to time actual entries within that regime. The 200-day itself, as a level, is far more tradeable than the cross as a signal — the number of algorithms and mandates keyed to "price above/below the 200-day" makes it a genuine line in the sand where real buying and selling shows up.

How to Read Them — Step by Step
Here's the actual sequence, the one you run on every chart before you risk a dollar.
Step 1 — Establish bias from the slowest line. Go to the daily. Where's price relative to the 55 EMA, and is the 55 rising or falling? Rising and price above = bias up. Falling and price below = bias down. Flat 55 with price chopping across it = no bias, stand down (this is the single most protective rule in this guide).
Step 2 — Read the stack. On your trading timeframe, note the order of the EMAs top to bottom. In a clean uptrend the fast line is on top: 12 > 22 > 55, all sloping up, evenly spaced. That's stacked bullish. Reverse for bearish. A tangled, crossing knot means no trend.
Step 3 — Read the spacing. Widening gaps between the EMAs = accelerating trend (strength). Compressing gaps = momentum fading, trend maturing or a range forming. This is your early warning system.
Step 4 — Find the active support/resistance line. In an uptrend, which EMA is price bouncing off on pullbacks? That's your live level. On the 5-min it's often the 12; on the daily it might be the 22 or 55. Mark it. That's where your entries live.
Step 5 — Check crosses in context. A cross of the 12 over the 22 in the direction of the daily 55 bias is a signal. The same cross against the daily bias is noise most of the time. Crosses are only as good as the trend they happen inside.
Step 6 — Confirm across timeframes (the alignment section below).
The Slope-and-Separation Read
Two of those six steps deserve to be fused into a single skill, because together they're 80% of what the lines tell you: slope and separation. Slope is direction — is the line pointed up, down, or sideways, and how steeply. Separation is health — how far apart the stacked lines sit. A trend in its prime has steep, parallel slopes and wide, stable separation: all three lines marching up at a similar angle, evenly gapped, like an escalator. A trend that's dying shows flattening slope and compressing separation: the fast line curls first, the gaps shrink, the escalator levels off into a walkway. You will see the top of a move in the slope-and-separation before price makes a lower high, because the lines are a smoothed derivative of price — they describe acceleration, and acceleration dies before direction does. Train your eye to read the fan, not the individual lines, and you get an early-warning system for free.

Worked Examples With Real Numbers
Example 1 — the EMA reacting faster than the SMA. Say a stock has traded flat around $100 and the 20 EMA and 20 SMA both sit at $100.00. Then a catalyst hits and it closes today at $106. The 20 SMA moves to roughly $100.30 — it added $6 but divided the change across 20 equal bars, so barely budges. The 20 EMA moves to about $100.57: 100 × 0.9048 + 106 × 0.0952 = 90.48 + 10.09 = $100.57. Same data, the EMA has already leaned nearly twice as far toward the new reality. Over a three-day run, that head start compounds and the EMA sits meaningfully closer to price — which is exactly why trend traders trust it to signal turns sooner.
Let's carry that run forward to make the compounding vivid. Say the stock keeps climbing: day two closes $109, day three $112, day four $114. Track both lines:
- Day 2: EMA = 100.57 × 0.9048 + 109 × 0.0952 = 91.00 + 10.38 = $101.38; SMA ≈ $100.75.
- Day 3: EMA = 101.38 × 0.9048 + 112 × 0.0952 = 91.73 + 10.66 = $102.39; SMA ≈ $101.35.
- Day 4: EMA = 102.39 × 0.9048 + 114 × 0.0952 = 92.64 + 10.85 = $103.49; SMA ≈ $102.05.
By day four the EMA sits at $103.49 and the SMA at $102.05 — a $1.44 gap, with the EMA hugging the advancing price far more tightly. If you were trailing a stop under the moving average, the EMA had you riding closer to price the whole way up, banking more of the move while still giving the trend room. That gap is the responsiveness you're paying for.
Example 2 — a 12/22/55 pullback long. NQ daily is in an uptrend: 55 EMA at 20,050 and rising, 22 at 20,300, 12 at 20,420, price at 20,480. Stacked bullish, bias up. Price pulls back over two days into the 22 EMA at 20,300, prints a hammer, and the 12 curls back up. You enter at 20,320 with a stop under the swing and the 55 at 20,040 — risk 280 points. With the 1:3 R/R minimum, your first target is 20,320 + 840 = 21,160, and the levels above (prior high, round number) confirm it's reachable. The 22 did the work; discipline banks it.
Now watch how the same setup gets disqualified, because knowing when a textbook setup is a trap is worth more than the setup itself. Same chart, but this time the pullback doesn't stop at the 22 — it slices through it and keeps going to the 55 at 20,050, and instead of a hammer you get a wide-range red candle that closes below the 55 at 20,010. The stack is now threatened: price is under the 55, the 12 has crossed under the 22, and the fan is compressing. This is no longer a pullback in an uptrend; it's a potential trend break. The disciplined trader does not "buy the dip" here just because the 55 is a support line — a close through the 55 is exactly the invalidation the framework warns about. You stand aside and wait to see whether price reclaims the 55 (thesis restored) or the 55 rolls over and starts falling (bias flips down). Same lines, opposite decision, and the difference is whether price respected or rejected the level.
Example 3 — the 505 rejection. "505 rejection" is HPT shorthand for a 55-EMA rejection setup: price rallies into the 55 from below in a downtrend, fails to close through it, and rolls over — the 55 acting as overhead resistance and confirming the bear bias. Concretely: daily bias is down (price under a falling 55 at 20,900). Price bounces for three days up to 20,880, tags the underside of the 55, prints a bearish engulfing candle, and closes back at 20,760. That's a 505 rejection — short entry at 20,750, stop above the 55 at 20,960 (210 risk), target 20,750 − 630 = 20,120. The exact confirmation rules are still being tightened in the HPT book, but the skeleton is: bias down, rally into the 55, rejection candle, go with the bias. The mirror image — a reclaim and hold above the 55 — flips bias bullish.

Example 4 — the crossover whipsaw that teaches the rule. Here's the losing trade every MA user takes until they learn. A stock is going nowhere — daily 55 dead flat at $50, price oscillating $48 to $52. On the 15-minute the 12 crosses above the 22, and an untrained trader buys at $51 "because the EMAs turned bullish." Two hours later price rolls back to $49, the 12 crosses back under the 22, the trader stops out for a dollar, then flips short — and price immediately reverses to $51 again. That's the whipsaw machine: three signals, three losses, all fees. The lesson isn't "crosses don't work." It's that a cross with no higher-timeframe bias behind it is not a signal at all. The daily 55 was flat. Step 1 of the read said stand down. Everything after that was optional pain.
Example 5 — spacing as an exit signal. You're long NQ from the Example 2 pullback, riding it up. For four days the 12, 22, and 55 fan wider and wider — 12 pulling away from 22, 22 pulling away from 55 — trend accelerating, you hold. Then on day five, price makes a marginal new high but the 12 stops pulling away from the 22 and the gap between them shrinks even though price is still green. That compression is your early tell that momentum is fading beneath a still-rising price. You don't have to exit on it, but you tighten your trail from the 22 up to the 12, and when the next candle closes below the 12 you're out near the high — while the trader watching only price is still waiting for an obvious top that comes 300 points lower.
How Moving Averages Behave in Different Market Regimes
The same three lines are a precision instrument in one regime and a random-number generator in another. Knowing which regime you're in is the entire difference between an MA that prints money and one that bleeds it.
In a Clean Trend
This is the MA's home turf. In a trending market the averages do exactly what the textbook promises: they stack in order, they slope steadily, they act as dynamic support/resistance, pullbacks respect them, and crosses in the trend direction resume the move. Here you can trust the lines, size up, buy pullbacks to the fast EMA, and trail behind it. The 55 defines the regime, the 22 catches the pullbacks, the 12 times the trigger. Everything in this guide "works" because it was designed for this environment. Your only job is to confirm you're actually in it before you apply it.
In Chop / Range
A ranging market is where MAs go to lie to you. Price oscillates through every average, so every line gets crossed constantly and every cross is a fake. The lines braid together, flatten out, and lose all predictive value — an EMA can't be "support" when price is closing above and below it every third bar. The tells that you're in chop: the 55 is flat (not sloping), the 12/22/55 are tangled and repeatedly crossing rather than stacked, and separation is near zero. The correct MA strategy in a range is to not use MAs for entries at all — you switch to range tools (support/resistance edges, mean-reversion off the range boundaries) or you stand down. The single most profitable MA skill is recognizing chop early and refusing to trade the lines through it. Most account damage from moving averages happens in exactly this regime, from traders applying trend logic to a trendless market.

In High Volatility / News-Driven Blowoffs
When volatility explodes — a gap, a Fed print, an earnings reaction, a liquidation cascade — price detaches violently from the averages and the lines lag far behind. In this regime two things change. First, the distance between price and the EMAs stretches to extremes; price can run 3–4% away from even a fast EMA, which in a normal tape would be a "too far, expect mean reversion" signal but in a blowoff just keeps going. Second, the averages become almost useless as timing tools because they can't keep up — by the time the EMA catches price, the move is often over. The professional adjustment: in high-vol conditions you widen your stops (the "noise around the line" is now huge), you lean on the slower averages for bias and ignore the fast ones for entries, and you respect that a snap-back to the fast EMA after a blowoff can be as violent as the move itself. High-vol is when "EMA as a precise level" breaks down and "EMA as a general zone" is the only honest reading.
The Transition — Squeeze to Expansion
The most valuable regime to catch is the handoff from chop to trend. It shows up in the averages as a squeeze: the fast and slow EMAs compress into a tight braid, separation collapses to almost nothing, slopes go flat — the market coiling. Then one candle breaks the braid apart and the lines fan out in one direction. That fan-out from a squeeze is often the birth of the cleanest trend you'll trade all month, because the compression was the accumulation. Pros hunt these transitions specifically: a long braid is not "boring, avoid" — it's "loaded, watch," and the break of the braid with expanding separation is the entry the range-bound traders miss entirely.
Combining EMAs With Other Tools — Confluence
An EMA level is good. An EMA level that lines up with other evidence is a trade. HPT runs timeframe-weighted confluence — the more independent tools pointing at the same price, and the higher the timeframe, the more weight the level carries. Stack these on top of your EMAs:
- Horizontal structure: a prior swing high/low or round number sitting at the same price as the 55 EMA. Two reasons to bounce beats one.
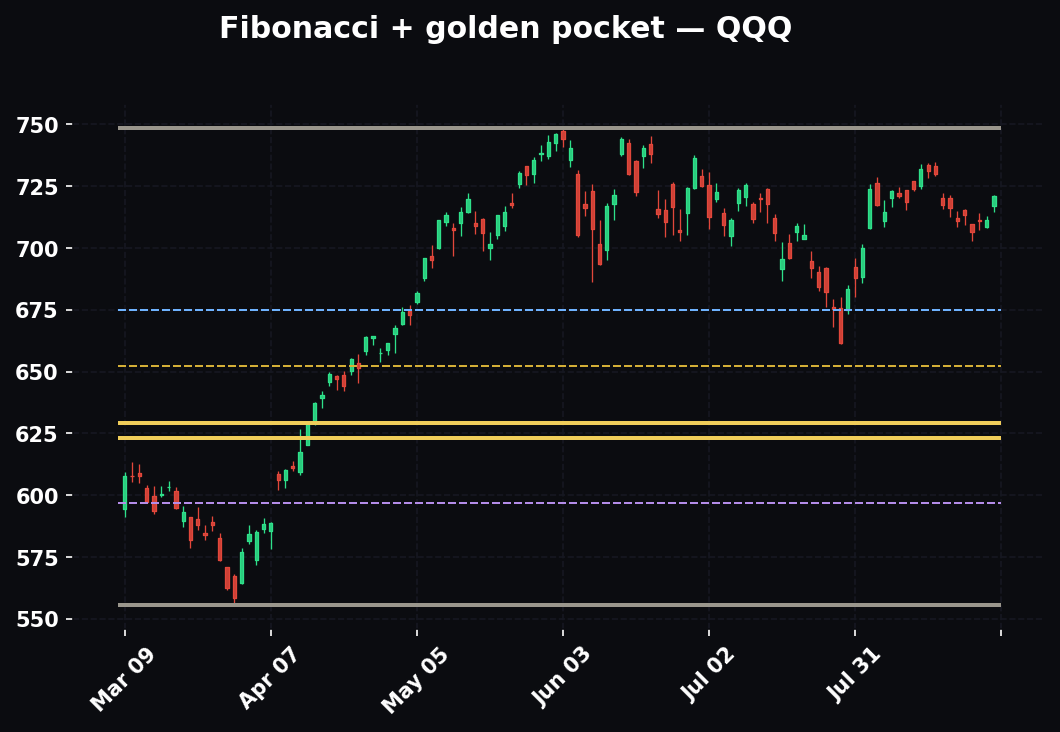
- Fibonacci golden pocket (0.618–0.65): when the golden pocket of the last leg overlaps a rising 22 or 55 EMA, that's a high-odds pullback zone.
- VWAP and anchored VWAP: intraday, when the EMA and VWAP converge, institutions and trend traders are watching the same line — it holds harder.
- Volume: a bounce off the 55 on rising volume is real; the same bounce on dead volume is suspect.
- RSI / MACD: a pullback to the 22 EMA that coincides with RSI resetting to ~40–50 in an uptrend, or a MACD histogram that's stopped expanding against you, adds momentum confirmation to the level.
The EMA gives you where; the other tools tell you whether to trust it. Never trade an EMA in isolation when a five-second scan of the chart could have told you the level had backup — or didn't.
Worked Confluence Stack — the EMA Plus Fib Plus VWAP
Let's build one real confluence read so you see how the weight accumulates. NQ, daily bias up (price above a rising 55). Intraday on the 15-minute, price is pulling back from a morning high. You mark three things independently:
- The rising 22 EMA on the 15-minute sits at 20,410.
- The golden pocket (0.618–0.65 retracement) of the morning's up-leg falls between 20,405 and 20,420.
- Session VWAP is riding at 20,415.
Three independent tools — a trend line, a Fibonacci ratio, and a volume-weighted average — all cluster inside a 15-point band around 20,410. That's not one level; that's three reasons stacked at one price, each derived a completely different way. When price flushes into that band and prints a reversal candle on a volume uptick, you have a confluence entry with real weight behind it: bias (daily 55), location (Fib), dynamic support (22 EMA), and institutional reference (VWAP) all agreeing. The stop goes just below the band (say 20,388, under the noise) and the target rides the daily bias up. This is the difference between "the EMA is here so I'll buy" and "four independent things say this price matters." One is a guess; the other is a plan.

Confluence With Structure — Why the Overlap Multiplies
There's a reason overlapping levels hold harder than the sum of their parts, and it's about who's watching. The 55-EMA buyer, the Fibonacci trader, the round-number trader, and the VWAP algo are four different populations with four different reasons to act at the same price. When their levels coincide, all four populations buy in the same few ticks, and their combined order flow is what turns a "level" into an actual bounce. A lone EMA has only the EMA crowd behind it. A stacked level has four crowds. That's why timeframe-weighted confluence isn't mysticism — it's a headcount of the order flow waiting at a price.
Multi-Timeframe EMA Alignment
This is where good traders separate from the pack. The idea: the higher timeframe sets the bias, the lower timeframe times the entry, and you only take trades where they agree.
Run it like this. Daily 55 says bias up. Drop to the 1-hour: is price above its 55 too, or is it pulling back into it? When the 1-hour pulls into a rising 55 while the daily is still stacked bullish, you drop to the 5- or 15-minute and wait for the fast EMAs to cross back up — the 12 reclaiming the 22 — as your trigger. Now three timeframes point the same way: daily bias, hourly pullback into support, 5-min momentum turning up. That's a weighted-confluence, aligned-EMA entry, and it's about as clean as trading gets.
The opposite — a 5-minute long signal fighting a daily that's below a falling 55 — is a counter-trend scalp at best. You can take it, but small, fast, and with no illusions. When the timeframes disagree, the higher one usually wins; respect the weight.
The Three-Timeframe Rule of Thumb
A practical scaffold pros use: pick three timeframes roughly 4–6x apart and assign each a job. For a swing trader that might be daily (bias), 1-hour (setup), 15-minute (trigger). For a scalper, 1-hour (bias), 15-minute (setup), 2-minute (trigger). The bias timeframe answers "which way am I allowed to trade?" The setup timeframe answers "is price at a location worth trading from?" The trigger timeframe answers "is momentum turning now?" You never skip the bias frame to chase a trigger, and you never demand the trigger frame agree with the bias frame at all times — the trigger frame is supposed to be temporarily against the trend during a pullback; that pullback is the opportunity. The art is letting the low timeframe get ugly (pullback, red candles, fast EMAs crossing down) within an intact high-timeframe trend, then buying when the low timeframe heals.
When Timeframes Fight — Reading the Conflict
Real charts rarely give you all three timeframes in perfect agreement, and learning to grade the degree of conflict is a pro skill. Rank them:
- Full alignment (all three same direction, stacked): highest conviction, full size.
- Bias + setup agree, trigger pulling back: the ideal entry window — the pullback is the gift.
- Bias agrees, setup is chopping: wait; the setup frame will resolve, don't force it.
- Bias up but setup frame broke its 55: caution — the higher trend may be transitioning; reduce size or stand aside.
- Trigger says go, bias says opposite: counter-trend scalp only, tiny size, quick exit, no adding.
That ladder turns "the timeframes disagree, I'm confused" into "here's exactly how much conviction this specific disagreement earns." Beginners freeze on conflict; pros price it.
Reading the Ribbon
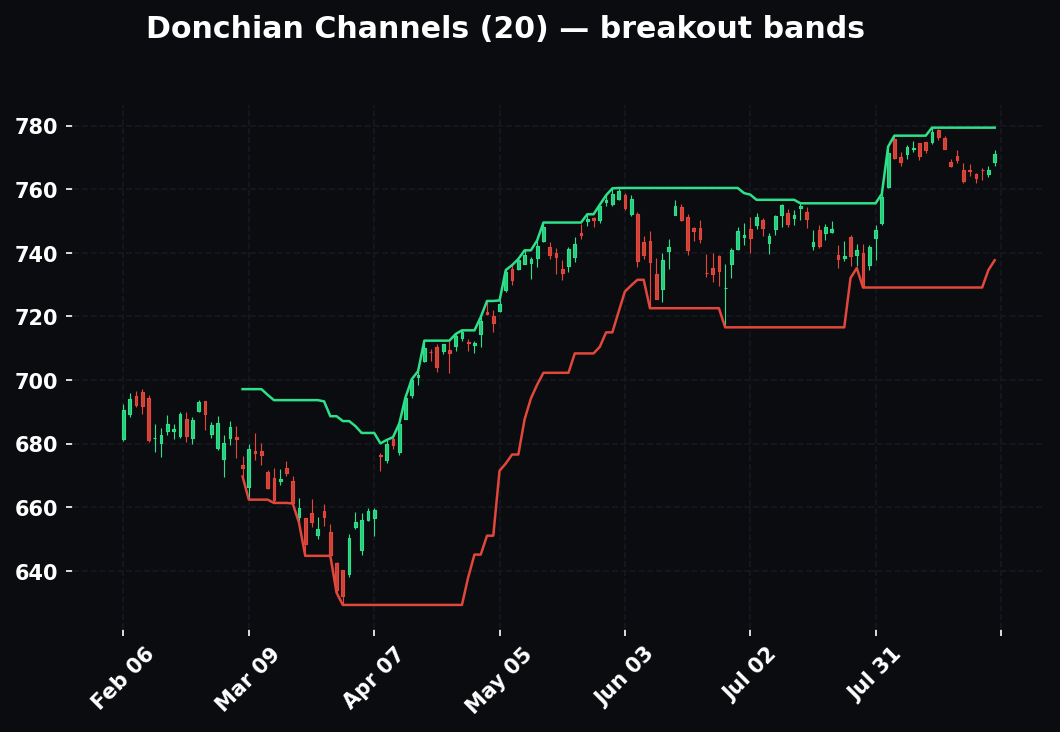
A ribbon is a fan of many EMAs plotted together — commonly 8 to 15 of them, say the 8, 13, 21, 34, 55… out to 200. You don't read the individual lines; you read the shape and behavior of the band:
- Fanned wide and cleanly ordered (fast on top, slow on bottom, sloping the same way) = strong, orderly trend. Ride it.
- Compressed into a tight braid = consolidation, energy coiling. A ribbon that squeezes flat then suddenly fans out often marks the start of a powerful move — the compression was the market deciding.
- Twisted and crossing repeatedly = chop. No trend. Sit on your hands.
- Price pulling into the top of the ribbon in an uptrend = your dynamic support zone, deeper and more forgiving than a single line.
The ribbon trades precision for a feel of trend health at a glance. Great for a quick "is this trending or ranging" gut check before you zoom in.
The Ribbon as a Trend-Health Dashboard
Beyond those four states, the ribbon gives you a quality read that single lines can't. Watch how cleanly the band flips. In a robust trend, when price finally reverses, the ribbon rolls over in an orderly sequence — fast lines cross down through slow ones one at a time, top to bottom, like a wave. That orderly flip is a genuine trend change worth respecting. Contrast a fake reversal: the fast lines dip and cross but the slow half of the ribbon never flinches, stays fanned and sloping the original way, and price snaps back — the ribbon "held its shape." When the deep part of the ribbon refuses to flip, the trend is still intact and the wobble was noise. Reading which portion of the ribbon is moving — just the fast tips versus the whole band — is how you tell a pullback from a reversal without any other tool.
The Mistakes That Bleed Accounts
1. Chasing crosses. The 12 crosses the 22 and you slam the buy button. In a trend, fine. In a range, that cross will reverse on the next bar and the one after — an endless whipsaw machine, each one a small loss plus fees. A cross is only tradeable in the direction of the higher-timeframe bias. No bias, no cross trade.
2. Using MAs in chop. Moving averages are trend tools, period. In a sideways range price oscillates straight through every EMA, and every one of them turns into a false signal. If the daily 55 is flat and price is sawing across it, your MAs are actively lying to you. The skill isn't reading the average — it's knowing when not to.
3. Confusing length with timeframe. A "50 EMA" means nothing until you say on what timeframe. A 50 EMA on the 1-min and on the daily are different tools with different jobs. Always state both.
4. Treating an EMA as an exact price. It's a zone, not a laser line. Price will wick a few points through the 55 and reclaim it — that's normal. Set stops beyond the noise around the line, not at the line, or you'll get stopped on every routine wick.
5. Too many lines. Six sets of EMAs plus a ribbon plus everything else is a fog machine, not analysis. Pick one framework — for us, 12/22/55 — and learn its behavior cold.
6. Ignoring slope. Price above the 55 means little if the 55 is falling. A rising slope is half the signal. Flat MA = flat conviction.
7. Trading the cross instead of the retest. The highest-odds entries usually aren't the cross itself but the first pullback into the fast EMA after the cross, once the trend has proven it'll hold the line. Patience beats the itch.
8. Mixing MA types without knowing it. Loading a 50 SMA on one chart and a 50 EMA on another and treating them as "the 50" leads to phantom levels — they can sit a full percent apart in a fast move. Decide which you're using for which job (EMA for your 12/22/55, SMA for the institutional 200) and never confuse the two lines you're actually looking at.
9. Fighting the 200-day. Taking aggressive longs under a falling 200-day, or aggressive shorts above a rising 200-day, is trading into the biggest, most-watched wall of opposing order flow on the chart. You can scalp against it; you should not build a position against it. Respect the line the whole institutional world is keyed to.
10. Reading the average and ignoring the candle. The EMA tells you the level; the candle at the level tells you whether it's holding. Buying a "bounce off the 55" while the candle is a wide-range close through the 55 is buying a break and calling it a bounce. The level is a location; the price action at the location is the confirmation. You need both.
11. Optimizing the numbers instead of learning the behavior. Traders burn weeks backtesting whether 11/23/54 beats 12/22/55 by a hair. The specific numbers barely matter; consistency and reading skill matter enormously. A trader who knows the behavior of 12/22/55 cold will beat a trader with "optimal" settings they've never watched move. Pick a set, marry it, learn its tells.
12. No bias, full size. The worst version of every mistake above is doing it with size. When the daily 55 is flat and you're unsure, the answer is smaller or nothing — not the same size you use in a clean trend "to see what happens." Uncertainty is a position-size input, not something to trade through at full risk.
How the Pros Use Them Differently From Beginners
The lines are identical on both screens. What's different is everything around them.
Beginners react to the line; pros anticipate the level. A beginner waits for price to touch the 55 and then decides. A pro has the 55's projected location marked before price gets there — knows the EMA is rising into 20,410 by tomorrow, has the order resting or the alert set, and is acting at the level while the beginner is still processing that price arrived.
Beginners trade the signal; pros trade the context. To a beginner, "12 crossed the 22" is a buy. To a pro, that same cross is a buy only if the daily 55 agrees, the level has confluence, the slope is right, and the regime is trending. Same event, filtered through five conditions. The pro passes on nine crosses to take the tenth, and the tenth is the one that pays.
Beginners want the line to be exact; pros treat it as a zone with a story. The beginner is furious when price wicks through "their" 55 and reclaims — they got stopped. The pro expected the wick, placed the stop beyond it, and used the flush-and-reclaim as the actual entry, because a failed break through an EMA is a stronger signal than a clean touch.
Beginners use MAs alone; pros use them as one vote in a weighted count. No professional trades a bare EMA. It's always the EMA plus structure plus the higher timeframe plus what volume and the tape are doing. The EMA is where they look first and decide last.
Beginners add lines when confused; pros remove them. When a beginner's read isn't working, they add a fourth EMA, a second ribbon, another indicator — more inputs, more fog. When a pro's read isn't working, they zoom out and simplify: what's the daily 55 doing, what's the regime, am I even supposed to be trading this? Clarity comes from subtraction.
Beginners think the MA is a strategy; pros know it's a lens. The moving average doesn't generate an edge on its own — it organizes your view of trend, bias, and level so your actual edge (patience, confluence, risk management) can operate. Beginners hunt for the magic setting. Pros picked their three lines years ago and spent the time since learning to read the market through them.
Frequently Asked Questions
Which is better, EMA or SMA? Neither is universally better — they answer slightly different questions. Use the EMA when you want responsiveness and dynamic levels you'll trade off of (your 12/22/55). Use the SMA when you specifically want the slow, widely-watched institutional line, above all the 200-day, precisely because everyone else is watching that exact calculation. For most active trading, EMA-first.
What are the best moving average settings? The ones you'll actually learn and use consistently. HPT runs 12/22/55 for trend with the daily 55 as the bias tell, 9/21 for pure intraday momentum, and the 200 SMA for the institutional line. Chasing "optimal" settings is a trap — reading skill beats parameter tuning every time.
Should I use closing price or something else for the average? Default to close. The close is the price the market agreed on when the bar finished — the most meaningful single number of the bar. Some traders use an average of high/low/close (HL3) or the median for smoother lines, but close is standard and what most other participants' averages are built on, which keeps your levels aligned with theirs.
Can a moving average predict the future? No. Every MA is built entirely from past prices — it lags by construction. What it does is describe the present trend clearly enough that you can make a probabilistic decision. It tells you the odds and the level, not the outcome. Anyone selling an MA that "predicts" is selling a curve-fit.
Why do I keep getting whipsawed by crosses? Almost certainly because you're trading crosses in a range with no higher-timeframe bias behind them. Add the rule "only take a cross in the direction of the daily 55" and refuse to trade when the daily 55 is flat. That one filter removes the majority of whipsaw losses.
How far can price stray from an EMA before it snaps back? It depends entirely on regime and volatility. In a normal trend, price stretched far above the fast EMA tends to mean-revert toward it. In a high-volatility blowoff, price can run several percent away and keep going — the "too far" signal fails in that regime. Don't use distance from the EMA as a standalone reversal signal; use it as context alongside the volatility environment.
Do moving averages work on all assets and timeframes? The behavior is universal because the math is universal, but the reliability scales with liquidity and how many participants watch the same lines. Highly liquid, widely-followed markets (index futures, major stocks, majors) respect their MAs more cleanly because more order flow is keyed to them. Thin, ignored markets respect them less.
Should I put moving averages on a 1-minute chart? You can, for scalp momentum (9/21), but the lower the timeframe the more noise and the more false crosses. Never let a 1-minute cross override your daily bias. The fast frame times entries; it does not set direction.
How many moving averages should be on my chart? As few as do the job. Three for trend (12/22/55) plus optionally the 200 SMA for the institutional line. More than that and you're building fog. A ribbon is fine as a separate trend-health glance, but for execution, keep it clean.
What's the single most important rule? The daily 55 as bias tell, and the corollary: flat 55, stand down. Rising 55 with price above means look for longs; falling 55 with price below means look for shorts; flat 55 with price chopping across it means the best trade is no trade. That one rule protects more capital than everything else in this guide combined.
The "How to Actually Use It" Playbook
Monday morning, in order:
- Set your chart. 12/22/55 EMA on every timeframe. Add the 200 SMA on the daily for the institutional line. That's it — no fog.
- Read the daily 55 first. Rising with price above = long book. Falling with price below = short book. Flat = reduced size or no-trade. This is your bias tell and it governs everything below.
- Confirm the stack on your trading timeframe. Stacked in the direction of daily bias = green light. Tangled = wait.
- Mark the live support/resistance EMA — the one price is actually bouncing off — and the nearest horizontal level and golden pocket. Where they overlap is your zone.
- Drop a timeframe and wait for the trigger — the 12 reclaiming the 22 in your direction, on a pullback into the zone, ideally with a confirming candle and volume.
- Size for 1:3 minimum. Stop beyond the EMA-plus-noise, first target three times your risk, and check that real structure supports the target before you take the trade. If the math doesn't give you 1:3 to a believable level, pass.
- Manage against the fast EMA. Trail behind the 12 (scalps) or 22 (swings). A decisive close on the wrong side of your trend EMA is the exit.
- If the daily 55 is flat, close the laptop. The best MA trade in chop is no trade.
A Full Trade, Start to Finish
Put the whole playbook into one narrated trade so the sequence is muscle memory. It's 8:15am. You pull up NQ daily: 55 EMA at 20,050 and rising, price at 20,470, stack is 12 > 22 > 55 all up. Bias: long book. You drop to the 1-hour — price has been pulling back for the last six hours into a rising 1-hour 22 at 20,440, and the 1-hour 55 sits below at 20,380 as a backstop. Setup: pullback into support inside an intact uptrend. You mark confluence: the 1-hour 22 at 20,440 overlaps the golden pocket of yesterday's up-leg (20,435–20,450) and session VWAP is climbing into 20,445. Three tools, one band around 20,440. You drop to the 5-minute and wait — you do not buy yet. Price flushes to 20,438, prints a hammer that closes back at 20,452, and the 5-minute 12 crosses back up through the 22. Trigger. You enter 20,455, stop at 20,412 (below the band and the noise, under the 1-hour 55's shadow) — risk 43 points. First target: 20,455 + 129 = 20,584, and there's clean air to the prior high above it, so the target is believable. 1:3 confirmed. You manage against the 5-minute 12 on the way up, then hand off to the 15-minute 22 as it extends, and you're out when a 15-minute candle closes decisively below the 22 near 20,620 — a runner well past your 1:3 minimum. Every step was a rule, not a feeling. That's the whole game.

Quick-Reference Cheat-Sheet
Types
- SMA — equal weight, smooth, slow, has the drop-off effect. Use for the 200-day institutional line.
- EMA — recent bars weighted heavier (multiplier 2÷(period+1)), reacts faster, no drop-off. Default for trend + levels.
- WMA — linear weighting, faster than SMA, choppier. Building block for Hull.
- Hull — near-zero lag, fast trend direction signal. Not for precise levels.
The math to remember
- Multiplier = 2 ÷ (period + 1). 20 EMA ≈ 0.095; 9 EMA = 0.20; 200 EMA ≈ 0.01.
- EMAtoday = Closetoday × mult + EMA_yesterday × (1 − mult).
- Shorter period = bigger multiplier = faster line.
Sets & jobs
- 9/21 — scalp momentum (1–5 min).
- 12/22/55 (HPT) — trend; 12 = tactics, 22 = the trade, 55 = the regime. Daily 55 = bias tell.
- 20/50 — swing (1H–daily); which line pullbacks reach grades trend strength.
- 50/200 — institutional trend; golden cross (50 over 200) / death cross (50 under 200) = regime confirmation, not entries.
Reads
- Stacked fast-over-slow, all sloping same way = clean trend.
- Slope = direction; separation = health. Widening = strengthening; compressing = fading/coiling.
- EMA = dynamic support (uptrend) / resistance (downtrend), as a zone, not a line.
- 505 rejection = price rallies into the 55, fails, rolls over — trade with the bias.
- Ribbon fanned = trend; braided tight = squeeze (loaded); twisted = chop (stand down).
- Squeeze → fan-out = birth of the cleanest trends.
Regimes
- Trend = MA's home turf; trust the lines, buy pullbacks, trail the fast EMA.
- Chop = MAs lie; flat 55, tangled lines — don't trade the crosses at all.
- High vol = lines lag badly; widen stops, lean on slow lines for bias, EMA is a zone not a level.
Multi-timeframe
- Higher timeframe sets bias, lower times entry, both must agree.
- Three frames ~4–6x apart: bias / setup / trigger. Let the trigger frame get ugly within an intact bias.
- Timeframe conflict is graded, not binary — price the disagreement, don't freeze on it.
Rules
- Crosses only count with the higher-TF bias.
- MAs are trend tools — flat 55 = stand down.
- Stops beyond the line, not on it. Read the candle at the level, not just the level.
- Confluence multiplies weight — EMA + structure + Fib + VWAP + volume.
- 1:3 R/R minimum, to a believable target, or pass.
- Learn the behavior of three lines cold; don't optimize the numbers.
The levels do the work. Discipline banks it. Learn the behavior of three lines cold, respect the daily 55, read the regime before you read the cross, and never fight a flat tape — that's ninety percent of what a moving average will ever give you, and it's more than enough.
Bound by rules, feared by trade.