
Open any chart, any platform, and there's a decent chance the Relative Strength Index is already sitting under it. It's the default second study for a reason — it's one of the oldest, most-studied momentum tools in the game, built by J. Welles Wilder Jr. and published in his 1978 book New Concepts in Technical Trading Systems, the same book that gave us ATR, ADX, and Parabolic SAR. Four indicators from one book, and every one of them is still on professional screens almost fifty years later. That's not nostalgia. That's durability.
And yet most traders use maybe ten percent of what RSI actually offers. They watch for the number to hit 70, they call it "overbought," they short — and they get run over by a trend that keeps grinding higher for three more weeks. Then they blame the indicator. They do the same thing at 30 in reverse, catch a falling knife, and blame it again.
The indicator is fine. The reading was wrong.
This is the definitive breakdown. We're going to take RSI apart down to the arithmetic, rebuild it, and show you the signals that professionals actually trade — divergence, hidden divergence, range shifts, RSI trendlines, failure swings, and the 50-line cross — while teaching you to treat overbought/oversold for what it really is: a momentum reading, not a reversal order. We'll cover how RSI behaves in trends versus chop versus high-volatility panic, how to weight it across timeframes, how it stacks with EMAs, structure, and volume, and the eleven mistakes that quietly drain accounts. By the end you'll be able to use this Monday morning and know why every piece of it works.
Let's go.

What RSI Actually Is
RSI is a momentum oscillator. Two words, both important.
Momentum means it measures the speed and strength of price movement — not the direction of the trend itself, but how forcefully price is moving. A market can be trending up while its momentum is slowing — that's one of the most valuable things RSI reveals, and we'll spend a lot of time on it. Oscillator means it's bounded: it swings back and forth inside a fixed range, in this case 0 to 100. Price can go to infinity; RSI cannot. It's permanently caged between zero and one hundred, and that cage is what makes it useful. It gives you a normalized, apples-to-apples read on momentum whether you're looking at NQ at 20,000, gold at 2,400, or a $4 penny stock. A move that looks enormous in dollar terms and a move that looks tiny both get expressed on the same 0–100 dial. That normalization is the entire point.
Here's the one-sentence version to hold in your head: RSI measures the average size of up-day gains relative to the average size of down-day losses over a lookback period. When up moves dominate, RSI rises toward 100. When down moves dominate, it falls toward 0. When they're roughly balanced, it sits near 50.
The default lookback is 14 periods — 14 bars of whatever timeframe you're on. On a daily chart that's 14 days; on a 5-minute chart it's 14 five-minute bars; on a weekly chart it's roughly a quarter of trading. Wilder chose 14 and it stuck, but the number matters and we'll come back to it in detail.
What RSI Is Not
Three quick disambiguations, because they cause real confusion:
- RSI is not "relative strength" in the stock-comparison sense. When an equities analyst says a stock "has relative strength," they mean it's outperforming its index or sector — a ratio of one instrument to another. Wilder's Relative Strength Index compares an instrument to its own past, not to anything else. Same two words, completely different tool. Keep them separate in your head.
- RSI is not a trend indicator. It will not tell you the direction of the primary trend. It tells you the character of the current move. You need structure and moving averages for direction; RSI describes the force behind that direction.
- RSI is not a standalone system. It's a lens. Anyone selling you "the RSI strategy" as a complete method is selling you half a trade.
The Mechanism: Why It Works
You cannot trade an indicator you treat as a black box. So let's build RSI from scratch. It's simpler than it looks, and understanding the arithmetic is what lets you feel the number instead of just reading it.
Step 1 — Measure each bar's change. For every bar in your lookback, take the close minus the prior close. If it's positive, that's a "gain." If it's negative, that's a "loss" (recorded as a positive number — we track the size of the loss, not its sign). Flat closes count as zero on both sides.
Step 2 — Average the gains and the losses separately. Over 14 bars, sum all the gains and divide by 14 to get average gain. Do the same for losses to get average loss. Note carefully: you divide by 14 in both cases, not by the number of up days — so a period with only 3 up days but three huge gains can still produce a high average gain. This is why a market that gaps up hard a few times and drifts sideside otherwise can show a surprisingly high RSI. Size matters more than frequency.
Step 3 — Compute Relative Strength (RS). This is the actual "relative strength" the index is named after.
RS = Average Gain / Average LossStep 4 — Normalize it into the 0–100 cage.
RSI = 100 − (100 / (1 + RS))That formula is the whole engine. Let's sanity-check it with real numbers so the scale stops being abstract and starts being intuition.
- Suppose over 14 days the average gain is 1.0 and the average loss is 1.0 — perfectly balanced. RS = 1.0 / 1.0 = 1. RSI = 100 − (100 / 2) = 50. Balance produces 50. That's your equilibrium line.
- Now the bulls take over: average gain 2.0, average loss 1.0. RS = 2. RSI = 100 − (100 / 3) = 100 − 33.3 = 66.7. Up moves twice as big as down moves gets you to the mid-60s.
- Push harder: average gain 3.0, average loss 1.0. RS = 3. RSI = 100 − (100 / 4) = 75. Now you're "overbought."
- Total capitulation, no down closes at all: average loss approaches 0, RS approaches infinity, RSI approaches 100.
- The mirror: average gain 1.0, average loss 3.0. RS = 0.333. RSI = 100 − (100 / 1.333) = 100 − 75 = 25. Oversold.
- One more, the near-flat drift: average gain 1.1, average loss 0.9. RS = 1.22. RSI = 100 − (100 / 2.22) = 100 − 45 = 55. A gentle uptrend barely lifts RSI off the centerline. This is why chop lives in the 45–55 band.
Notice something the arithmetic just taught you: to get RSI to 75, up moves have to be three times the size of down moves, sustained across the lookback. That's not a fluke or an accident of a single bar. That's a genuinely strong, persistent trend. Which is your first clue that "overbought" is not a warning — it's confirmation that momentum is powerful. Hold that thought; it's the hinge of this entire guide.
The Smoothing Nobody Explains
One technical note that matters more than people think. After the very first calculation, Wilder did not recompute a fresh simple average every bar. He used a smoothing method — a running average mathematically close to an exponential moving average, sometimes called Wilder's smoothing or an RMA. Each new bar's average gain is the prior average gain times 13, plus today's gain, divided by 14. Same for losses.
Two practical consequences fall out of this:
- RSI has memory. A single explosive bar doesn't just spike RSI and vanish — it lingers in the average and decays slowly over the following bars. This is why RSI doesn't whipsaw as violently as a raw momentum reading would.
- RSI reacts asymmetrically to your platform's lookback setting. Because it's smoothed, the difference between a length-9 and a length-14 RSI is not just "faster" — it's a genuinely different memory horizon. A 9-period RSI forgets last week; a 21-period RSI still remembers it.
You don't need to do this math by hand; every platform does it for you. But now you know what the line under your chart is actually made of, and why it moves the way it moves.
Length: What Changes When You Change 14
The default is 14, and you should generally keep it. But understand the trade-off you're making if you touch it:
- Shorter (7–9): Faster, noisier, more reactive. RSI reaches the extremes more often and produces more signals — most of them false. Useful for scalping and very short timeframes where you want early warning and can tolerate whipsaw. A 7-period RSI on a 1-minute chart will tag 80 and 20 many times a day.
- Default (14): The well-tested middle. Enough smoothing to filter noise, enough reactivity to be timely. This is what every reference to "overbought" and every divergence textbook is implicitly built on.
- Longer (21–25): Slower, smoother, fewer signals but higher quality. RSI rarely reaches the extremes; the centerline and the 40/60 zones become the story. Useful for swing and position trading where you want to ignore the noise entirely.
The rule: pick one, learn its personality, and stop changing it because you didn't like the last signal. Constantly re-optimizing the length is a tell that you're curve-fitting your feelings, not reading the market.
Reading The Scale, Step By Step
The 0–100 range has traditional landmarks. Learn them, then learn why the crowd misuses them.
- 70 and above — "overbought." Up moves have dominated hard. The traditional read: extended, due for a pullback.
- 30 and below — "oversold." Down moves have dominated hard. Traditional read: washed out, due for a bounce.
- 50 — the centerline. The single most underrated level on the indicator. Above 50, average gains exceed average losses over the lookback — bulls control momentum. Below 50, bears do. Crossing 50 is a genuine momentum shift and, in many systems, a cleaner signal than either extreme.
Here is the mistake that costs people money, stated plainly: overbought does not mean sell, and oversold does not mean buy. Overbought means momentum is strong to the upside. In a downtrend, "overbought" bounces are where you look for shorts. In a strong uptrend, "overbought" is where price lives — it can stay pinned above 70 for weeks while the trend runs and every "it's overbought" short gets stopped out.
Wilder himself, and later Constance Brown in her influential work Technical Analysis for the Trading Professional, made this point emphatically: in a strong trend, RSI doesn't respect the textbook 30/70 bands. Brown's key insight — which we'll build the "range shift" section on — is that RSI operates in different ranges depending on the market regime. That's the professional-grade read, and it's why two traders can look at the same RSI at 42 and one calls it "not oversold yet" while the other calls it "the buy zone." One of them is reading the regime. The other is reading a textbook printed in 1978.

The Centerline Is the Real Signal Line
Spend a week just watching the 50 line and you'll never look at RSI the same way. Most durable momentum systems are built around the centerline, not the extremes, for a simple reason: 50 is where control changes hands.
In an uptrend, RSI pulls back to 50 (or the 40–50 zone) and bounces. Each successful defense of that zone is the trend telling you it's still intact. The moment RSI closes below 50 and starts capping out under it, the momentum baton has been handed to the sellers — often before price has confirmed anything. The centerline cross is early, clean, and far less crowded than the 70/30 trade.
So if 70/30 is overrated and 50 is underrated, what do you actually trade? Six things, in ascending order of professionalism: the centerline cross, regular divergence, hidden divergence, range shifts, RSI trendlines, and failure swings. Let's take them one at a time.
Signal One: Regular Divergence (The Reversal Tell)
Divergence is RSI's headline act. It's when price and momentum disagree — and momentum usually tells the truth first.
Regular bearish divergence: price makes a higher high, but RSI makes a lower high. Price pushed to a new peak, but it did so with less momentum than the last peak. The tank is running on fumes. This warns of a potential top or pullback.
Regular bullish divergence: price makes a lower low, but RSI makes a higher low. Price dug to a fresh low, but with less downside force behind it. Selling is exhausting. This warns of a potential bottom or bounce.

Worked example — bearish divergence. Say you're long NQ on the 15-minute. Price rallies to a swing high at 20,150 and RSI prints 78. Price pulls back to 20,040, then rallies again to a higher high at 20,210 — new high, feels great — but this time RSI only reaches 68. Higher price, lower RSI. That's regular bearish divergence. The second push was weaker under the hood. Momentum topped before price did. This is your cue to tighten stops, take partial profit, or watch for a reversal trigger — not to blindly short, which brings us to the golden rule of divergence:
Divergence is a warning, not an entry. It tells you the current move is tiring. It does not tell you the reversal has started. Markets can diverge for a long time before they turn — a strong trend can print three consecutive bearish divergences and keep climbing, taking out every trader who shorted the first one. You wait for divergence to be confirmed by price: a break of structure, a failed retest, a trendline break. Divergence loads the gun. Price pulls the trigger.
Grading Divergence Quality
Not all divergences are equal. Learn to grade them so you're not treating a coin-flip signal like a high-conviction one:
- Location. Divergence at a known level — a prior swing high, a round number, a value-area edge — is worth ten times a divergence in open air. The level is the reason; RSI is the confirmation.
- Steepness of disagreement. A price high 3% above the last, met by an RSI reading 15 points lower, is a violent disagreement. A price high fractionally above the last with RSI one point lower is barely a divergence at all.
- Overbought/oversold context. Bearish divergence that forms with the RSI high up in the 75–80 zone is more meaningful than one forming at 60 — the momentum had somewhere to fall from.
- Number of pushes. A clean two-push divergence (A then a weaker B) is textbook. A three-push divergence (A, B, weaker C) after an extended run is often the exhaustion top itself.
The Trap: Divergence in Strong Trends
Here is where divergence traders die. In a powerful trend, momentum naturally cools on each successive leg because the biggest, most explosive move usually comes first (the "kickoff") and later legs are calmer grinds. That produces a steady drip of divergences the entire way up — none of which mark the top. If you mechanically short every bearish divergence in a bull market, you will be short the whole run.
The defense is simple and non-negotiable: in a confirmed trend, only trade divergence with a structure break. No lower low broken (for a bearish setup), no trade. The divergence is your watch-list trigger; the structure break is your entry trigger. In ranges and at major exhaustion points, divergence is far more reliable because there's no dominant trend manufacturing false signals.
Signal Two: Hidden Divergence (The Continuation Tell)
This is the one most retail traders have never heard of, and it's arguably more useful because it trades with the trend instead of against it — which is where the higher-probability money lives.
Hidden divergence is the mirror image of regular divergence. It shows up on pullbacks within a trend and signals the trend is about to resume.
Hidden bullish divergence (uptrends): price makes a higher low, but RSI makes a lower low. The pullback dug momentum deeper than the last dip, yet price held above the prior low. Translation: the dip flushed out weak hands, momentum reset, and the uptrend is coiled to continue. This is a buy-the-dip signal with an actual reason behind it.
Hidden bearish divergence (downtrends): price makes a lower high, but RSI makes a higher high. The bounce carried more momentum than the last one, but price failed to reclaim the prior high. The rally is a trap. Continuation lower.

Worked example — hidden bullish divergence. NQ is in a clean daily uptrend, price above the rising 55-EMA. It pulls back. The prior swing low was 19,800 with RSI at 42. This pullback holds higher, bottoming at 19,950 — a higher low, respecting the trend — but RSI dips to 38, a lower low. Price higher, RSI lower, on a pullback in an uptrend. That's hidden bullish divergence. It's telling you this dip is a buying opportunity, not the start of a reversal. Pair it with a bounce off the 55-EMA and you've got a textbook trend-continuation entry with a stop that lives just under 19,800.
Worked example — hidden bearish divergence. A stock is in a daily downtrend, capped by a falling 22-EMA. It bounces. The prior bounce peaked at $48 with RSI at 55. This bounce carries higher momentum, RSI reaching 61, but price stalls at $47.20 — a lower high. Price lower, RSI higher, on a bounce in a downtrend. The rally had more energy but less result — buyers spent everything and still couldn't reclaim the last high. That's the trap. Short the failure back below the bounce's structure, stop above $48.
Here's the clean way to remember all four:
- Regular divergence appears at the extremes (the highs of an uptrend, the lows of a downtrend) and warns of reversal.
- Hidden divergence appears on the pullbacks and signals continuation.
Regular = "the move is ending." Hidden = "the pause is ending." A memory hook: in hidden divergence, the RSI extreme is hidden further out than the price extreme (RSI makes the new low/high, price doesn't). In regular divergence, price makes the new extreme and RSI doesn't.
Signal Three: RSI Range Shifts (Reading The Regime)
This is Constance Brown's contribution and it separates amateurs from pros. Forget the idea that 70 and 30 are fixed guardrails. In reality, RSI shifts its operating range based on which side controls the market.
In a bull regime, RSI oscillates roughly between 40 and 80. Overbought (near 80) gets hit and exceeded on rallies. Pullbacks bottom out around 40–50 — the 40 level acts as support. RSI rarely touches 30. If you're waiting for "oversold" to buy in a bull market, you'll wait forever and miss the whole run.
In a bear regime, RSI oscillates roughly between 20 and 60. Selloffs push near 20; bounces stall at 50–60 — the 60 level acts as resistance. RSI rarely reaches 70.
Why this is gold: the range itself tells you the regime, and the boundary of the range becomes a tradeable level.

Worked example. You're watching a stock and RSI has, over the last two months, repeatedly bottomed at 43, 45, 41 on pullbacks and topped near 82 on rallies. That's a textbook 40–80 bull range. Now price pulls back and RSI drops toward 42 again. A trader screaming "it's not oversold, only 42!" is misreading the tape. In this regime, 42 is the buy zone. When RSI holds that 40 floor and turns up, you buy the continuation. The day RSI slices through 40 and starts respecting 20–60 instead — that's your early warning the bull regime is breaking and control has flipped to the bears. The range shift often precedes the trend change.
The Shift Itself Is the Signal
Don't just use the range to place trades within a regime — watch for the transition, because that's where the biggest edge is. The sequence of a top forming often reads like this on RSI, in order:
- RSI stops tagging the 80 zone on rallies (upside momentum fading).
- A pullback breaks the 40 floor that had been holding for weeks.
- The next bounce fails at 60 instead of pushing back to 80.
- Now RSI is oscillating 20–60. The regime has flipped, and price usually confirms shortly after.
You caught that at step 2 or 3, well before the "everyone can see it now" price breakdown at step 4. That's what reading the regime buys you: time.
Tying the Regime to the 55-EMA
This is why HPT anchors trend to the EMA 12/22/55 stack and treats the daily 55-EMA as the bias tell — it defines the regime you're in. RSI range confirms it from the momentum side. When price is above a rising daily 55-EMA and RSI is respecting a 40–80 range, those two tools are agreeing, and agreement across independent tools is what confluence means. When they disagree — price still above the 55-EMA but RSI has quietly dropped into a 20–60 range — the momentum is warning you the trend is hollowing out before the moving average catches up. Believe the leading tool, prepare for the lagging one to follow.
Signal Four: RSI Trendlines
RSI prints its own highs and lows, which means you can draw trendlines on the oscillator itself — and RSI trendlines frequently break before the corresponding trendline on price. Momentum leads.
Connect the swing lows on the RSI line during an uptrend. As long as RSI holds above that rising line, momentum is intact. When RSI breaks its own uptrend line, momentum has cracked — often a bar or two ahead of price breaking its structure. Same in reverse for downtrends: draw across RSI's descending highs, and a break above is your early momentum-shift signal.

Worked example. NQ's price is grinding up but the RSI swing lows form a clean rising line — 55, 58, 61. Price makes one more high, but RSI slices below that rising trendline down to 52. Momentum's uptrend is broken even though price hasn't broken its own trendline yet. That's your heads-up to get defensive before the price break confirms. Combine an RSI trendline break with a regular divergence at the same spot and you've got two independent momentum signals stacking — a much higher-quality warning than either alone.
A caution: RSI trendlines are more art than science, and it's easy to draw the line you want to see. Keep them to obvious, multi-touch lines. If you have to squint or cherry-pick the touch points, it isn't there. A real RSI trendline has at least two clean touches and preferably three.
Signal Five: Failure Swings (Wilder's Own Favorite)
Most people skip this, but Wilder considered failure swings among the strongest signals RSI gives — and importantly, they don't require price to make a divergent high or low, so they fire in situations divergence misses.
Bearish failure swing: RSI pushes above 70, pulls back to a small trough (say 68), rallies again but fails to exceed its prior peak, then breaks below that trough. That break of the trough is the signal — momentum tried to make a new high and couldn't, then broke its own recent support.
Bullish failure swing: RSI drops below 30, bounces to a small peak, sells off again but holds above its prior low, then breaks above that peak. The break of the peak confirms momentum has bottomed.
Worked example. RSI on the 1-hour tags 74, dips to 69, then rallies but only reaches 72 — lower than 74. Price, meanwhile, may have made a marginal new high or just a double top. Then RSI cracks back below 69. That failure swing is a clean momentum-rollover signal even without a picture-perfect price divergence, and it often lines up with a small double-top in price for confluence. Think of the failure swing as divergence's cousin that watches RSI's own structure instead of comparing RSI to price.
The Big Idea: RSI Is A Filter, Not A Trigger
Everything above collapses into one principle. Use RSI to describe the environment and confirm momentum — not to time your exact entry.
A trigger is a specific "enter now" event: a candle close through a level, a break of a structure high, a bounce off the 55-EMA. RSI is bad at triggers and great at context: Is momentum strong or fading? Are price and momentum in agreement or diverging? What regime are we in? Answer those, then let price — structure, levels, candles — pull the trigger.
Practically, that means RSI is a permission slip. Before you take a long, ask: is RSI above 50 (bulls in control)? Is it respecting a bull range? Is there hidden bullish divergence on this pullback, or at least no bearish divergence warning me off? If yes, you have RSI's permission to look for a long at your price level. RSI didn't tell you where to buy. It told you buying is the right side of the trade. That distinction — side versus entry — is the whole discipline.

RSI Across Market Regimes
The single biggest reason traders misread RSI is that they use one playbook for a tool that behaves completely differently in three different environments. Learn all three.
Trending Markets
In a strong trend, RSI's extremes stop meaning "reversal" and start meaning "confirmation." Overbought in an uptrend is strength. The tools that work here are the centerline defense (RSI bouncing off 40–50 and continuing), hidden divergence on pullbacks, and range persistence (RSI staying inside its 40–80 or 20–60 band). Regular divergence is dangerous here — trade it only with a structure break. Your bias is set: buy dips in an uptrend, sell rips in a downtrend, and use RSI to time the continuation, not to fight the trend.
Ranging / Choppy Markets
This is the only environment where the textbook 30/70 reversal trade actually works well, because there's no dominant trend to overpower the oscillator. Price bounces between support and resistance; RSI bounces between roughly 30 and 70 in sympathy. Buy support when RSI is oversold, sell resistance when RSI is overbought — but the level is still the trade and RSI is still just confirmation. The killer here is that ranges eventually break, and the last "oversold buy" or "overbought sell" before the breakout is the one that hurts. Watch for RSI to fail to reach its usual extreme, or to punch clean through the range boundary — that's the range ending and the trend beginning.
High-Volatility / Panic Markets
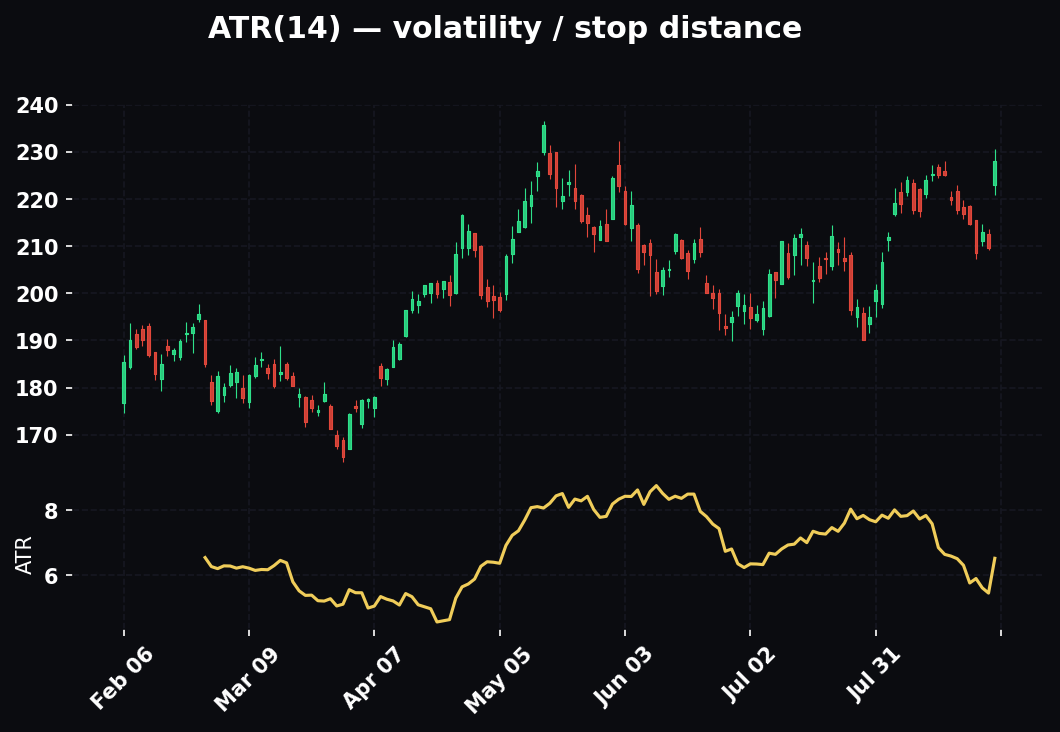
In a fast, high-volatility environment — a crash, a squeeze, a news-driven spike — RSI goes to extremes and stays there, and its signals get noisy and early. During a genuine capitulation, RSI can print single digits (below 10) and the market keeps falling for another day; during a face-ripping squeeze it can pin near 90. The lesson: in high vol, deep RSI readings tell you the move is violent, not that it's over. Wait for volatility to contract and for a failure swing or a confirmed structure shift before acting. Widen your expectations for how extreme RSI can get, and lean harder on price confirmation than usual, because the oscillator alone will fire early and often.
Multi-Timeframe RSI
RSI on a single timeframe is a partial picture. The professional read stacks at least two, and the higher one wins.
The principle: higher-timeframe momentum sets the bias; lower-timeframe momentum times the entry. They are not equals. When they conflict, the higher timeframe is the truth and the lower timeframe is noise or, at best, a pullback within the higher-timeframe move.
Worked example — aligned. Daily RSI is 62 and rising within a 40–80 bull range; the trend is up and momentum confirms it. You drop to the 15-minute for an entry. Price pulls back, 15-minute RSI dips to 38 (oversold on that timeframe) and prints hidden bullish divergence. That "oversold" 15-minute reading is not a warning — inside a daily uptrend it's a gift. The timeframes agree on direction; the lower one just handed you a discounted entry. High-conviction long.
Worked example — conflict. Daily RSI 34, in a 20–60 bear range — bias is down. The 5-minute rips to RSI 76, "overbought." A beginner shorts nothing and maybe even buys the 5-minute strength. The correct read: the 5-minute overbought bounce inside a daily downtrend is exactly where you look to short, because the dominant timeframe says down. Never let a lower-timeframe RSI signal override a higher-timeframe one. That's timeframe-weighted confluence, and it's non-negotiable.
A practical rule of thumb: use timeframes roughly 4x–6x apart (5-min and 30-min; 15-min and 1-hour; 1-hour and 4-hour; daily and weekly). Too close together and they just echo each other; too far apart and they're describing different trades.
Confluence: Stacking RSI With Everything Else
RSI alone is a coin flip with extra steps. Inside a confluence framework, it's a genuine edge. Here's how it stacks with the tools around it.
With trend structure (EMA 12/22/55). The 55-EMA defines bias; RSI confirms momentum on that bias. Price above a rising daily 55-EMA + RSI holding a 40–80 range = a bull regime confirmed two ways. When they disagree — price above the 55 but RSI breaking down through 40 — that's a warning the trend is hollowing out. The best trend entries come when price pulls back to the 55-EMA at the same time RSI pulls back to its 40–50 floor and both hold together. That's two independent tools drawing the same line in the sand.
With horizontal levels and structure. Divergence means far more when it lands at a level. Bearish divergence that prints exactly as price tags a prior swing high or a known resistance shelf is a real signal. The same divergence in the middle of nowhere is noise. The levels do the work; RSI tells you the level is going to hold.
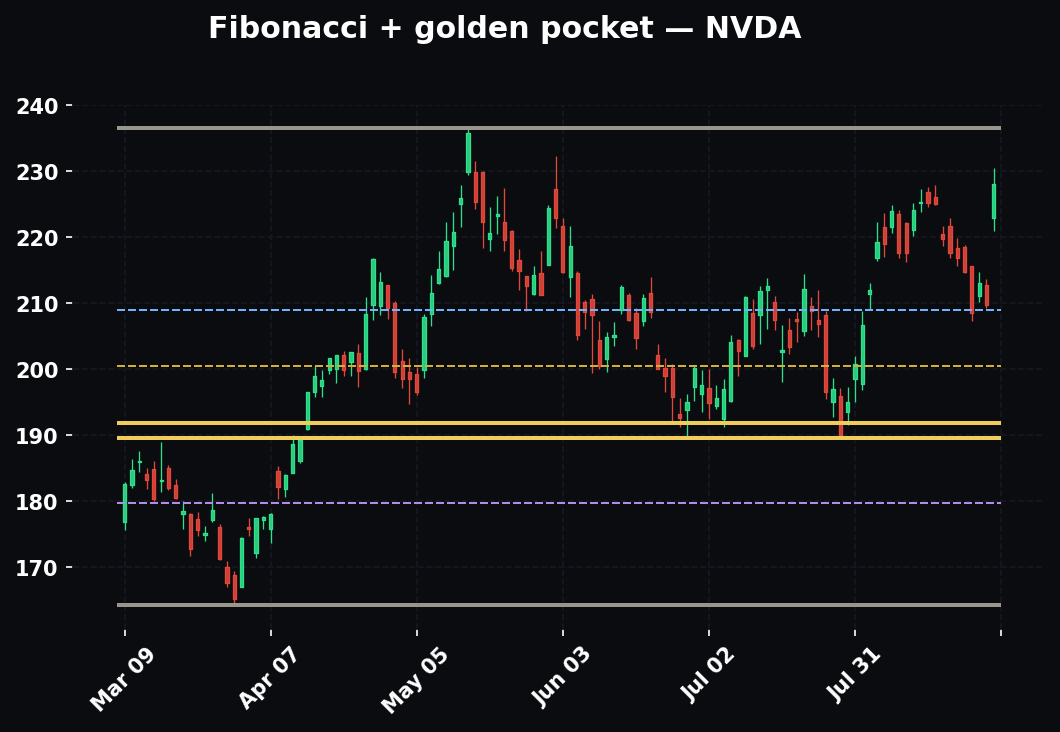
With the golden pocket (0.618–0.65 Fibonacci retracement). A pullback into the golden pocket that also shows RSI defending its bull-range floor and hidden bullish divergence is one of the cleanest continuation setups on the chart — a price level, a momentum floor, and a momentum-vs-price disagreement all pointing the same way at the same spot.

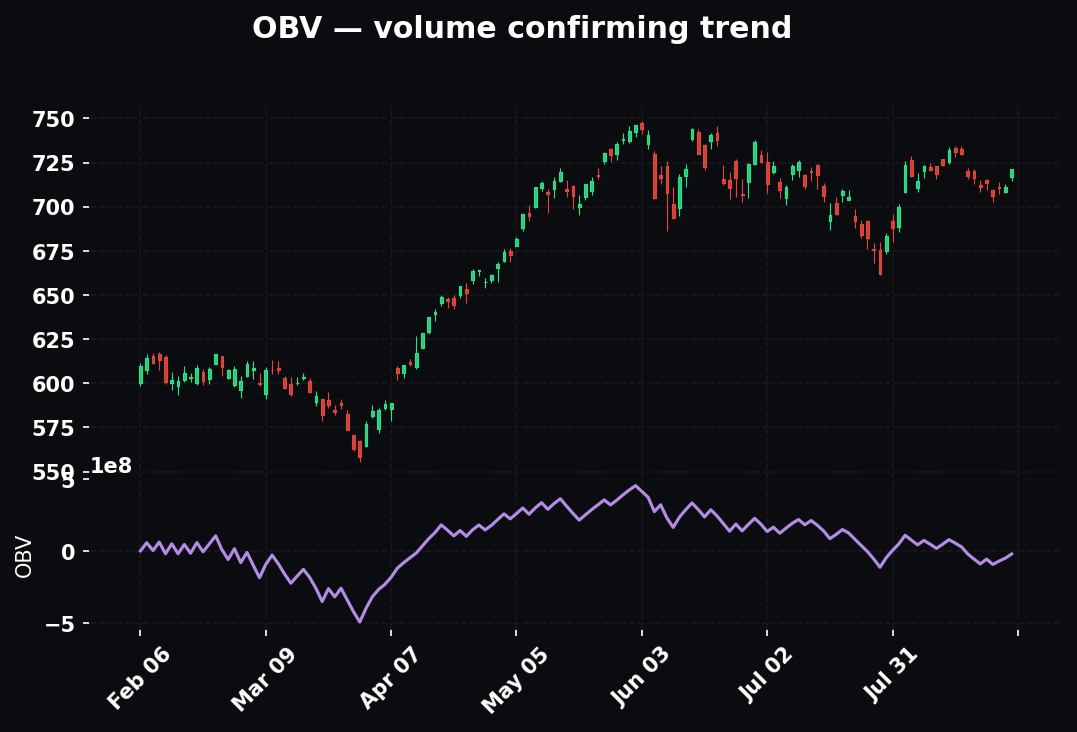
With volume. Bearish divergence into a high on declining volume is the highest-conviction version — momentum and participation both fading. Two tanks empty, not one. Conversely, a bullish divergence at a low that comes with a volume spike (capitulation flush) is the classic exhaustion-bottom fingerprint: sellers threw everything they had and RSI still made a higher low.
With candlestick triggers. RSI gives permission; a candle pulls the trigger. Hidden bullish divergence at the 55-EMA is your setup; a bullish engulfing or a hammer off that level is your entry bar. Now the timing is price's job, exactly where it belongs.
The rule: an RSI signal is a green light only when at least one independent tool agrees. No confluence, no trade.
How The Pros Use RSI Differently From Beginners
The gap between a beginner's RSI and a professional's RSI isn't the indicator — it's identical on both screens. It's the interpretation. Here's the split, laid out honestly:
- Beginners watch 70 and 30. Pros watch 50 and the range. The amateur's whole game is the extremes; the professional's game is the centerline and which band (40–80 or 20–60) the market is respecting.
- Beginners see overbought as "sell." Pros see overbought as "strong." In a trend, the pro reads a pinned-high RSI as confirmation to stay long, not a cue to fade.
- Beginners trade divergence as an entry. Pros trade it as a heads-up. The pro waits for price to break structure; the beginner shorts the first divergence and gets run over.
- Beginners use one timeframe. Pros stack timeframes and weight the higher one. The pro would never let a 5-minute overbought reading override a daily uptrend.
- Beginners trust RSI alone. Pros demand confluence. For a pro, RSI is one voice in a chorus; it never votes alone.
- Beginners re-optimize the length constantly. Pros leave it at 14 and learn its personality. Curve-fitting the setting is a beginner tell.
- Beginners react to the current print. Pros read RSI's own structure — its trendlines, its failure swings, whether it's making higher or lower momentum highs. They read the oscillator like a second price chart.
- Beginners want RSI to be a system. Pros know it's a filter. The pro's edge is in the levels and the risk management; RSI just keeps them on the right side.
The Common Mistakes (Read This Twice)
1. Shorting "overbought" in an uptrend. The cardinal sin. RSI hitting 75 in a strong uptrend is confirmation of strength, not a reversal signal. In a bull regime, RSI lives above 70 for extended stretches. Shorting into that is standing in front of a train because the train is going fast. If you must fade, wait for divergence plus a structure break — never the overbought reading alone.
2. Buying "oversold" in a downtrend. Same sin, mirrored. RSI at 25 in a bear regime is strength to the downside. "It's so oversold it has to bounce" is how accounts die. Down can get more down, and in a real decline RSI will sit oversold for days while price keeps sliding.
3. Trading divergence without confirmation. Divergence can persist far longer than you can stay solvent. It's a warning to prepare, not a signal to fire. Wait for price to break structure and confirm. This one mistake accounts for a huge share of blown accounts among traders who think they've found an edge.
4. Ignoring the regime / using fixed 30-70 bands blindly. If you're not reading whether RSI is in a 40–80 or a 20–60 range, you're using the wrong reference lines for the market you're actually in. The 30/70 textbook trade only reliably works in ranges — the exact environment beginners are worst at identifying.
5. Fiddling the length to fit your bias. A shorter RSI (say 7) is faster and noisier — more signals, more false ones. A longer RSI (21) is smoother and slower. Pick one, understand its character, and stop changing it because you didn't like the last signal. The default 14 is a sane, well-tested middle.
6. Forgetting the timeframe hierarchy. A 1-minute RSI signal that contradicts the daily is not an edge; it's noise dressed up as a signal. The higher timeframe always wins the bias.
7. Treating RSI as a standalone system. It isn't one. It's a momentum lens. No confluence, no trade. Anyone marketing "the RSI strategy" as complete is selling you half a method.
8. Drawing the divergence you want to see. Confirmation bias is brutal on divergence. If you have to squint, cherry-pick the swing points, or ignore the peak that doesn't fit, it isn't a real divergence. Use obvious, clean swings only. A divergence that needs defending isn't one.
9. Forgetting RSI is smoothed and lagging. RSI has memory; a single huge bar decays slowly. Don't expect it to snap instantly to a reversal — it won't. It confirms and contextualizes; it doesn't call the exact tick.
10. Fading RSI extremes during high-volatility panic. In a crash or a squeeze, RSI goes extreme and stays extreme. Single-digit RSI in a capitulation is not "time to buy" — it's "this is violent." Wait for volatility to contract and structure to shift.
11. Watching only the number, never RSI's structure. The current print is the least useful thing about RSI. Its trend, its trendlines, its failure swings, whether it's making higher or lower momentum peaks — that's the real information, and beginners miss all of it staring at a single value.
12. Confusing Wilder's RSI with stock "relative strength." They share a name and nothing else. One compares a market to its own past; the other compares one instrument to another. Mixing them up leads to nonsense reads.
The Playbook: How To Actually Use This Monday
Step 1 — Establish the regime. On your higher timeframe, is price above or below the 55-EMA? Is RSI respecting a 40–80 (bull) or 20–60 (bear) range? Is RSI above or below 50? Write down which regime you're in. This decides which side you're hunting. Do not skip this — it's the foundation everything else stands on.
Step 2 — Mark your price levels. Structure, prior swing highs/lows, key horizontals, the golden pocket on the active leg, session levels. RSI doesn't pick your entry — these do. Draw them first, before you even glance at the oscillator, so RSI can't bias where you "see" levels.
Step 3 — Wait for confluence at a level. In a bull regime: a pullback into support / the 55-EMA / the golden pocket, RSI holding its ~40 floor, ideally hidden bullish divergence. In a bear regime: a bounce into resistance, RSI stalling near ~60, ideally hidden bearish divergence. The more of these that stack at one price, the better.
Step 4 — Demand a price trigger. RSI gave permission; now let price confirm — a bullish candle off the level, a reclaim of a broken level, a break of the pullback's structure, a failure swing on RSI itself. Now you enter. Never before.
Step 5 — Size for 1:3 minimum. Stop goes where the read is wrong (below the higher low, below the 55-EMA, below the golden pocket). Target at least three times your risk. RSI got you pointed the right way; risk management banks it. A great read with bad sizing still loses money over time.
Step 6 — Manage with momentum. In the trade, watch for regular divergence against you — it's your early exit warning. Watch RSI's own trendline; a break is a heads-up to tighten. Watch the centerline; a decisive cross against your position is a real momentum shift. Let hidden divergence on pullbacks keep you in when the trend is just breathing.
The levels do the work. Discipline banks it. RSI just makes sure you're on the right side of the trade before you ever click the button.
Frequently Asked Questions
What's the best RSI setting? 14, applied to close. It's the well-tested default that every reference and every divergence pattern is implicitly built around. Go to 7–9 only if you're scalping very short timeframes and can tolerate noise; go to 21 for slower swing/position reads. Don't change it trade-to-trade.
Should I use 30/70 or 20/80 bands? Neither, blindly. Read the regime. In a bull market the relevant levels are roughly 40 (support) and 80 (overbought-but-normal); in a bear market they're 20 (oversold-but-normal) and 60 (resistance). In a genuine range, the classic 30/70 works. The bands should follow the market, not the other way around.
Is RSI a leading or lagging indicator? Both, honestly. It's derived from price so in the strict sense it lags — it can't know something price doesn't. But because it measures the rate of change, momentum often decelerates before price turns, so divergence and RSI trendline breaks frequently lead the price signal by a bar or two. Treat it as an early-warning system, confirmed by price.
Can I trade RSI on its own? You can, and you'll roughly break even minus fees over time. RSI's value is as a filter inside a confluence framework. Alone, it's incomplete.
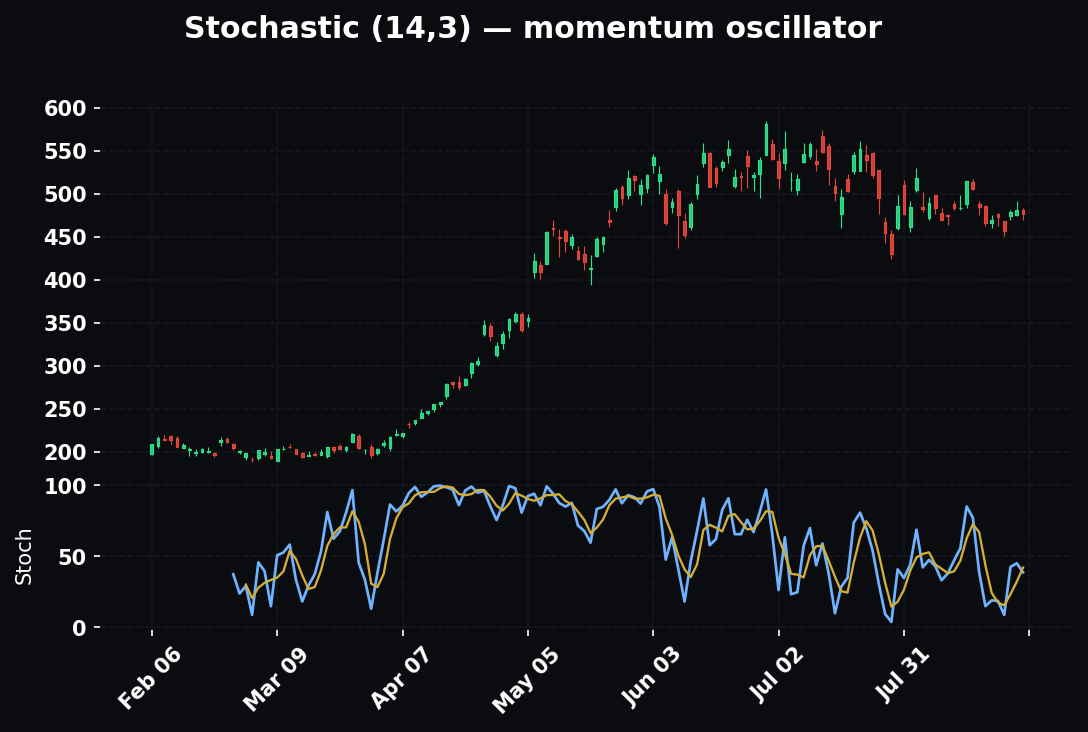
What's the difference between RSI and Stochastic? Both are momentum oscillators bounded 0–100, but they measure different things. RSI measures the size of gains vs losses; Stochastic measures where the close sits within the recent high-low range. Stochastic is faster and reaches extremes more often; RSI is smoother and better for divergence and regime reading. They're complementary, not redundant.
Why does RSI stay overbought so long in a strong trend? Because "overbought" just means up-moves are dominating by 3:1 or more, and in a strong trend that stays true for a long time. The reading is correctly describing sustained strength. It's not broken; it's telling you the trend is powerful.
Does RSI work on all markets and timeframes? Yes — that's the point of the 0–100 normalization. It works on futures, stocks, forex, crypto, on the 1-minute and the monthly. The interpretation (regime, confluence, timeframe weighting) is what stays constant; the tool travels everywhere.
How do I tell a real divergence from a fake one? Clean, obvious swing points; a meaningful gap between the momentum readings; a location at a real level; and — above all — wait for price confirmation. If you have to hunt for the divergence, it isn't tradeable.
RSI is at 50 and flat — what does that mean? Equilibrium and, usually, chop. A market grinding sideways keeps RSI pinned near 50 in a 45–55 band. Don't force momentum trades in that environment; wait for RSI to pick a side and leave the middle.
Quick-Reference Cheat-Sheet
The formula: RSI = 100 − (100 / (1 + RS)), where RS = Average Gain / Average Loss over 14 periods (Wilder-smoothed after the first bar).
The scale:
- 50 = momentum equilibrium (the real line that matters)
- Above 50 = bulls control momentum; below 50 = bears
- 70+ = strong up-momentum ("overbought" — NOT a sell in an uptrend)
- 30− = strong down-momentum ("oversold" — NOT a buy in a downtrend)
- Centerline cross = cleaner, less crowded signal than the extremes
Regime ranges (Brown):
- Bull regime: RSI oscillates ~40–80; 40 is support, rarely sees 30
- Bear regime: RSI oscillates ~20–60; 60 is resistance, rarely sees 70
- Range/chop: classic 30–70 reversal trade actually works here
- A break of the range floor/ceiling often precedes the trend change
The signals, ranked by usefulness:
- Centerline (50) cross/defense: control changing hands; the backbone signal
- Hidden bullish div: price higher low, RSI lower low → continuation (uptrend pullbacks) → buy the dip
- Hidden bearish div: price lower high, RSI higher high → continuation (downtrend bounces) → sell the rip
- Regular bearish div: price higher high, RSI lower high → reversal warning (at extremes)
- Regular bullish div: price lower low, RSI higher low → reversal warning (at extremes)
- RSI trendline break: momentum breaks before price → early warning
- Failure swing: RSI breaks its own recent trough/peak → rollover without needing price divergence
Regime playbook:
- Trend → centerline defense, hidden divergence, range persistence; fade only with a structure break
- Range → buy support / sell resistance with 30/70 confirmation
- High vol → extremes mean "violent," not "over"; wait for volatility contraction + confirmation
Multi-timeframe: higher timeframe sets the bias, lower times the entry; higher always wins a conflict; keep them ~4–6x apart.
Confluence partners: 55-EMA (bias), horizontal levels (the real trade), golden pocket, volume, candlestick triggers. At least one independent tool must agree — no confluence, no trade.
The one rule: RSI is a filter and a context tool, not a reversal trigger. It tells you which side and whether momentum agrees. Price pulls the trigger.
The mistakes to never make: shorting overbought in an uptrend; buying oversold in a downtrend; trading divergence without a price confirmation; using fixed 30/70 bands regardless of regime; drawing the divergence you want to see; fading extremes in a panic.
Default settings: length 14, applied to close. Don't fiddle it to fit your bias.
RSI isn't a magic reversal button, and the traders who use it that way spend their careers getting stopped out at exactly the wrong moment — short the overbought train, long the oversold knife, faded into a trend that never cared about the number on their screen. Used properly — as a momentum lens that confirms your side, reads the regime, warns you when the move under the surface stops matching the move on the screen, and hands the timing job back to price where it belongs — it's one of the most durable edges on the chart. It's been on those screens since 1978 for a reason.
Read the regime. Respect the levels. Let momentum confirm, and let price trigger.
Bound by rules, feared by trade.
Not financial advice.