
Most traders don't have an indicator problem. They have a redundancy problem. They stack RSI, Stochastic, CCI, Williams %R and MACD on one chart, watch all five light up green at the same time, and mistake that agreement for confirmation. It isn't. Those tools are all reading the same thing — price momentum off recent range — so of course they agree. Five momentum oscillators saying "overbought" is one opinion wearing five hats, not five votes. When they all scream buy and the trade fails anyway, the trader doesn't conclude the indicators were redundant. He concludes he needs a sixth one. That's how a chart ends up looking like a cockpit and trading like a coin flip.
This guide fixes that. Thirty indicators, sorted into the four things a chart can actually tell you: trend, momentum, volatility, and volume. Learn one strong tool from each bucket and you have a complete read — direction, thrust, expansion risk, and conviction — with no double-counting. That's the whole game. Everything past that is refinement, substitution for a specific instrument, or ego.
Before you read a single entry, internalize the frame, because the frame is worth more than any tool on the list: an indicator is a math transform of price and volume. It cannot know anything price doesn't already contain. It has no crystal ball, no order-flow oracle, no secret. It takes the same OHLCV bars you're already looking at and re-expresses them so one dimension of the move becomes easier to see. That's it. Once you truly believe that, the whole "which indicator is best" argument dissolves, because the answer is always the same: the best indicator is the one that shows you a dimension your other tools are blind to.

How to pick 3–4 instead of stacking 12
There are exactly four dimensions a chart can express:
- TREND — which way, and how strongly, is price moving over time?
- MOMENTUM — how fast is it moving right now, and is that speed fading?
- VOLATILITY — how wide is the range, and is it expanding or contracting?
- VOLUME — is real participation behind the move, or is it hollow?
Pick one indicator per bucket. Trend + momentum + volatility + volume = four non-redundant lenses. A clean default: EMA stack (trend) + RSI (momentum) + ATR (volatility) + VWAP or OBV (volume). That's it. That's a professional chart, and it fits on one screen with room to actually see the candles.
Everything else on this list is a substitution — a different flavor of the same bucket you'd swap in for your instrument or your style, not a stack you pile on top. Supertrend instead of the EMA stack if you want a hard trailing line. MFI instead of RSI if you want volume baked into your momentum. Keltner instead of Bollinger if you want your bands to breathe with true range instead of standard deviation. One per bucket. Substitute, don't stack. Read every entry below through that filter.
The redundancy test — a two-question filter before you add anything
Before any indicator goes on your chart, ask two questions. First: which of the four buckets does this live in? If you can't answer instantly, you don't understand the tool well enough to trade it. Second: do I already have a tool in that bucket? If yes, the new one has to replace the old one, not join it. You are not allowed to run two.
The only sanctioned exceptions to "one per bucket" in this entire guide are three specific pairings where the relationship between two tools is itself the signal: ADX riding alongside your trend tool as a regime filter, Bollinger-inside-Keltner forming the TTM squeeze, and — for intraday traders only — VWAP plus one accumulation line. Everywhere else, a second tool in a filled bucket is a mistake with a rationalization attached.
Why redundancy is actively dangerous, not just clutter
People think a redundant chart is merely messy. It's worse than messy — it's actively deceiving. Confluence is supposed to be independent confirmation: three unrelated witnesses telling the same story. When your three "witnesses" are RSI, Stochastic and CCI, you don't have three witnesses. You have one witness who changed clothes twice. And because your brain counts the agreement as three, your position sizing swells at the exact moment your evidence is thinnest. Redundancy doesn't just fail to help; it manufactures false confidence and pumps it straight into your risk. That's how accounts die — not from bad indicators, but from believing a solo act is a chorus.

The Hollow Point trend spine
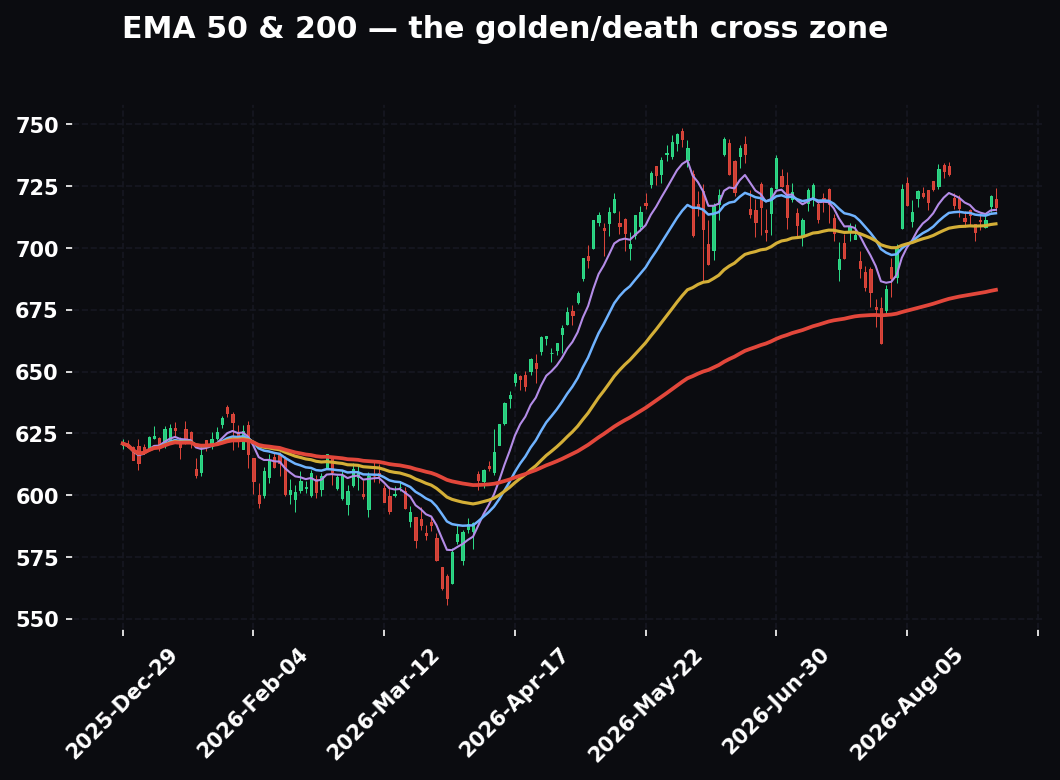
At Hollow Point the trend bucket is not negotiable: trend is EMA 12/22/55, and the daily 55 is the bias tell. Price above a rising daily 55 EMA, you're a buyer looking for pullbacks. Below a falling one, you're a seller. That single line sets the direction; the other three buckets tell you when and how hard. Note the specific periods — 12/22/55, not the retail-standard 9/21. The tighter fast pair reacts to real intraday shifts, and the 55 is slow enough to ignore noise but fast enough to bend inside a genuine trend change instead of lagging a week behind it. Every read in this house is built on that spine.
TREND — which way, how strong
Trend tools smooth the noise so you can see direction. They lag by design — that's the trade-off for not getting whipsawed on every tick. Use them to set bias and to trail, never to time an exact entry. The mistake beginners make with every tool in this bucket is the same: they treat a lagging line as a trigger. A moving average cross has already happened by the time you see it; the information is old. That's fine for bias and it's fine for trailing. It's poison for entries.
EMA / SMA (Moving Averages)
Measures the average price over N bars — SMA weights every bar equally, EMA weights recent bars heavier so it turns faster. The one signal that matters: the stack and the slope. When 12 > 22 > 55 and all three point up, trend is up, full stop. Price pulling back into a rising EMA and holding is the highest-quality continuation entry there is.
Worked example, step by step. NQ is trading 20,400. The 12 EMA sits at 20,350, the 22 at 20,280, the 55 at 20,100, all three sloping up — a clean bullish stack. Price sells off intraday into 20,290. That's a tag of the 22 EMA from above. You don't buy the touch blindly; you wait for the reaction — a bar that wicks into 20,285 and closes back at 20,320, holding the 22. That hold, with the stack intact beneath it, is your long. Stop goes below the 55 at, say, 20,080 — beyond the line that would break the whole structure. Entry 20,320, stop 20,080, that's 240 points of risk, so your minimum target is 20,320 + 720 = 21,040 for the 1:3. If the ATR says 240 is too tight to survive normal noise, the trade is too big — you size down, you don't move the stop.
The regime dependence is everything here. In a trending market, MAs are gold. In a chop range, price crosses back and forth through all three EMAs every few bars and the stack never holds — the tool is worthless and will hand you a loss on every cross. The EMA stack doesn't tell you whether to trust it; that's ADX's job (below).

MACD (Moving Average Convergence Divergence)
The distance between two EMAs (typically 12 and 26), plotted as a line, with a 9-EMA "signal" line and a histogram of the gap between them. It measures trend momentum — is the trend accelerating or tiring. The one signal: the histogram flipping while diverging from price. Price makes a higher high but the histogram makes a lower high = the trend is running out of fuel. The line-cross-signal is the popular signal and it's the weaker one; the divergence is the money.
Worked divergence example. ES rallies to a new swing high at 5,620, and the MACD histogram at that high prints a bar of +4.2. Two hours later ES grinds to 5,631 — a higher high in price — but the histogram only makes +2.1. Price went up; the force behind it dropped nearly in half. That's bearish divergence. It is not a short signal by itself — divergence tells you the current leg is tiring, not that a new leg down has started. You use it to tighten stops on longs and to get interested in shorts if and when price confirms with a structure break.
Best on daily and 4H for swing bias; on the 1-minute the histogram flickers so fast the divergences are meaningless noise. Regime note: in a violent trend, MACD can diverge for a long time before price rolls — divergence is a warning, not a stopwatch.
ADX / DMI (Average Directional Index)
ADX measures trend strength on a 0–100 scale, ignoring direction; the +DI and −DI lines tell you the direction. The one signal: ADX above 25 and rising = a real trend is on, trade with it. ADX below 20 and flat = no trend, range-trade or stand aside.
This is the single most under-used tool on the entire list, and it's the one that would save the most accounts. ADX is a regime switch. It doesn't tell you when to click — it tells you which playbook to load. Above 25 rising, you run the trend playbook: buy pullbacks to rising EMAs, let oscillators stay pinned, trail wide. Below 20 flat, you run the range playbook: fade the extremes, buy support, sell resistance, take profit fast, and completely ignore every "overbought is bearish / oversold is bullish" instinct — because in a range those instincts are correct, and in a trend they're suicide. The reason the same oscillator signal works one day and fails the next is almost always that the regime flipped and the trader didn't notice. ADX is how you notice.
Quick reads: ADX 15, flat = dead, stand down. ADX 22 and climbing = a trend is being born, get ready. ADX 35 = strong trend, press it. ADX 50+ and rolling over = the trend is mature and exhaustion risk is rising, trail tight and don't add.
Ichimoku Cloud
A full system in one overlay: a "cloud" (Kumo) projecting support/resistance ahead of price, plus two fast lines (Tenkan/Kijun). Measures trend, momentum, and future support in a glance. The one signal: price above the cloud = bullish, below = bearish, inside = no-trade. A thick cloud ahead is strong support/resistance; a thin one is weak. The "inside the cloud = no-trade" rule alone makes Ichimoku worth learning — it draws a literal box around the chop zone and tells you to keep your hands in your pockets. Excellent on daily and 4H for higher-timeframe bias; too busy and laggy for scalping. Beginners try to trade all five lines at once and freeze. Read only cloud position for bias and you've captured 80% of the value with 20% of the confusion.
Parabolic SAR (Stop and Reverse)
Plots dots that trail price and flip to the other side when the trend reverses. Measures trend direction and hands you a mechanical trailing stop. The one signal: the dot flip — dots below price = long, above = short. In a clean trend it trails beautifully. In chop it flips constantly and shreds you. Use it as a trailing stop in an established trend, never as an entry signal on its own. The classic misuse is treating every flip as a reversal entry; in a range that's ten losing trades before lunch. Gate it with ADX exactly like Supertrend.
Supertrend
An ATR-based trailing line that sits below price in an uptrend and above in a downtrend, flipping on a close through it. Measures trend direction with a volatility-adjusted buffer. The one signal: the flip on a bar close — green line below = long bias with the line as your stop. Cleaner than SAR because ATR gives it room to breathe: instead of a fixed acceleration factor, the buffer widens when the market is volatile and tightens when it's calm, so it survives the normal noise SAR chokes on. Great trend-follow tool for futures and crypto. It still whipsaws in ranges — nothing in the trend bucket survives chop — so gate it with ADX > 25 before you trust a flip.
Aroon
Two lines (Aroon Up, Aroon Down, 0–100) measuring how many bars since the most recent N-period high and low. It measures how fresh the trend is. The one signal: Aroon Up above 70 with Aroon Down below 30 = strong, young uptrend. When both drop toward 50 and tangle, the trend is stalling. Aroon's specialty is earliness — because it keys off the recency of new highs/lows rather than an average of price, it can flag a fresh trend before the EMAs finish stacking. Best on daily swing charts as a trend-onset detector you glance at, not a trigger you fire on.
Vortex Indicator
Two lines (VI+ and VI−) built from the relationship between current price and the prior bar's range, designed to catch trend changes. The one signal: the crossover — VI+ crossing above VI− signals a new uptrend. It's an alternative to DMI that tends to trigger a touch earlier. Use it as a trend-onset confirmer on swing timeframes; like all crossover tools, it's late and noisy in chop.
Trend bucket, pick one: EMA stack is the default. Supertrend or SAR if you want a mechanical trailing line. Ichimoku if you want higher-timeframe bias at a glance. Aroon or Vortex if you specifically hunt fresh trends. ADX rides alongside as your regime filter — it's the one trend tool that pairs rather than substitutes.
MOMENTUM — how fast, and is it fading
Momentum oscillators measure the speed of price relative to its recent range, usually bounded 0–100 (or around a zero line). Their real job isn't "overbought/oversold" — in a strong trend, overbought stays overbought for weeks. Their real job is divergence: when price makes a new extreme and momentum doesn't, the move is hollowing out. Warning: nearly every tool in this bucket is redundant with the others. Pick one. This is the single most over-populated bucket on every blown-up trader's chart, so the discipline matters most here.
The overbought myth, killed for good
Here is the sentence that will save you more money than any indicator: in a trend, an oscillator hitting overbought is confirmation of strength, not a reversal signal. When NQ is ripping and RSI pins at 78 for six straight bars, that pinning is the trend flexing. Shorting it because "it's overbought" is fighting the strongest force on the chart with the weakest logic on the chart. Overbought/oversold as a reversal read is range behavior. In a trend, the same reading means the opposite. This is why the regime call (ADX) comes before you interpret any oscillator — the identical number means "reverse" in a range and "press" in a trend.

RSI (Relative Strength Index)
Measures the ratio of average gains to average losses over 14 bars, scaled 0–100. The one signal: divergence, plus the 40/60 pivot in trends. In an uptrend, RSI tends to hold above 40 and top out near 80; a pullback that holds 40–50 and turns up is your continuation buy. Classic 30/70 overbought/oversold only works in ranges.
The 40/60 pivot is the RSI trick most people never learn, and it's the good one. In a healthy uptrend RSI doesn't visit 30 — the floor lifts to about 40. So instead of waiting for a "30 oversold" that never comes, you buy the hold of 40–50 on a pullback. Worked example: NQ in a daily uptrend pulls back four days; RSI falls from 71 to 44, then a bar closes green and RSI hooks up off 44. That hook, with the daily 55 EMA still rising beneath price, is a textbook continuation long. Mirror it in downtrends: RSI ceilings around 60, and rejections from 55–60 are your continuation shorts.
Divergence example: price prints a higher high at 21,000 but RSI tags 68 versus the prior swing's 74 — bearish divergence, tighten stops and stop adding. RSI is the default momentum tool for a reason — robust, readable, on every platform, and the 14-period setting is fine 95% of the time. Don't tinker with the length; tinker with your regime read.
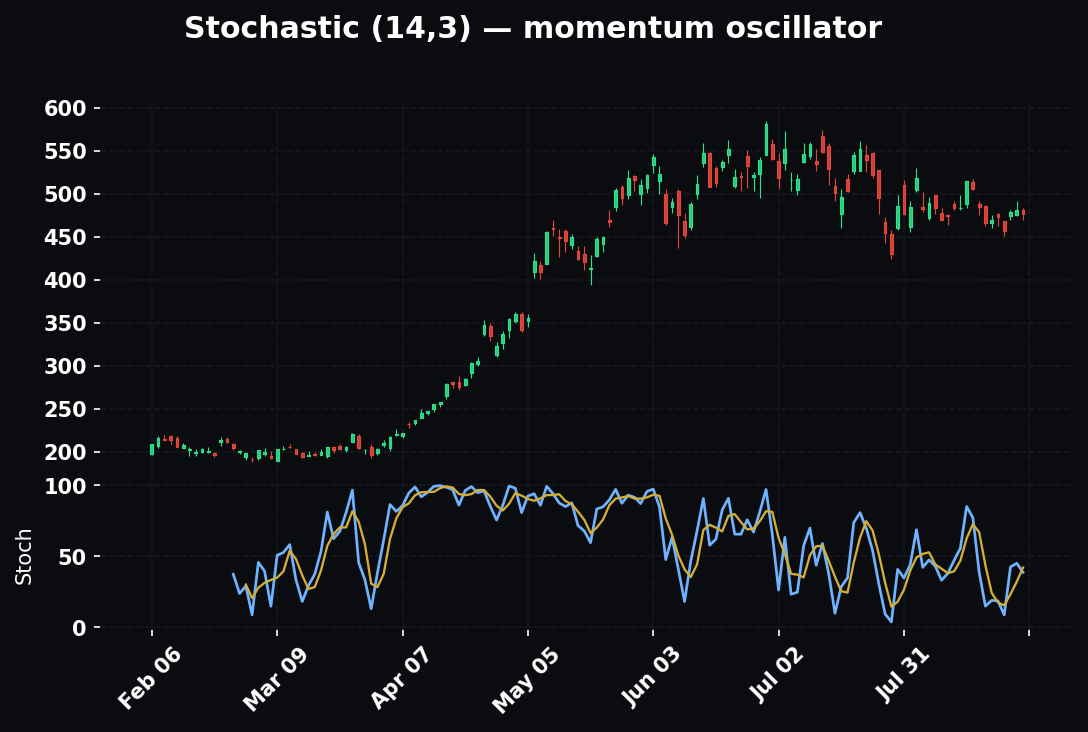
Stochastic Oscillator
Measures where the close sits within the recent high-low range (0–100), with %K and %D lines. It's faster and twitchier than RSI. The one signal: the %K/%D cross in the extreme zones — a cross up from below 20 in a range is a buy. Excellent for range trading and for timing entries inside a known level. In a strong trend it pins at the extreme and gives false reversal signals constantly. If you range-trade, Stochastic over RSI; if you trend-trade, RSI over Stochastic. You do not run both — they answer the same question.
Stochastic RSI
Runs the Stochastic formula on RSI values instead of price — a momentum reading of a momentum reading. Extremely fast and sensitive. The one signal: the turn out of 0 or 1 (0/100). It's an early-warning trigger for RSI hooks. Powerful for scalpers who want the earliest twitch; brutal for everyone else because it whipsaws — it's the espresso shot of oscillators. Use only intraday, only with a hard trend filter, and only if you can act on a signal in seconds. For a swing trader it's pure noise.
CCI (Commodity Channel Index)
Measures how far price has deviated from its statistical mean, unbounded but usually read at ±100. The one signal: crossing back inside ±100 — a drop back under +100 flags exhaustion; a push above +100 flags a breakout with thrust. It's a two-faced tool: in a range, the cross back inside is a reversal; in a trend, the push through +100 is a breakout confirmation. Which face you read depends — again — on the regime. Good on commodities and futures; noisy on low-volatility equities.
Williams %R
Essentially an inverted Stochastic on a −100 to 0 scale — measures the close's position in the recent range. The one signal: the turn out of −80 (oversold) / −20 (overbought). Functionally interchangeable with Stochastic; if you run one, you don't need the other, and running both is the redundancy trap in its purest form. Fast reversal timing in ranges. Same trend-pinning weakness as Stochastic.
ROC (Rate of Change)
Pure percentage change of price N bars ago — the most literal momentum reading there is. The one signal: the zero-line cross (momentum flips positive/negative) and divergence. No smoothing, no range-bounding, just raw thrust. Great for measuring the force behind a breakout — a breakout with ROC spiking hard has real acceleration; the same breakout with ROC limp is likely a fake. Useless for precise timing because it's so raw. Use it to confirm a move has muscle, not to time the entry.
Ultimate Oscillator
Blends momentum across three timeframes (7/14/28) into one 0–100 line, specifically to reduce the false divergences single-period oscillators throw. The one signal: confirmed divergence — because it's multi-period, its divergences are more trustworthy than RSI's. Use it when single-timeframe divergence keeps faking you out. Slower to trigger, which is the entire point — you're trading a few false signals for far fewer.
TRIX
A triple-smoothed EMA's rate of change — a momentum line with the noise scrubbed out. The one signal: the zero-line cross and signal-line cross. Because of the triple smoothing it filters minor wiggles and only speaks on meaningful shifts. Good for swing traders who want momentum without the chatter; too slow for intraday reversals.
Fisher Transform
Mathematically converts price into a Gaussian (bell-curve) distribution so turning points become sharp, near-vertical spikes instead of gentle curves. The one signal: the sharp reversal spike and signal-line cross. It makes tops and bottoms visually obvious after they form. Useful for confirming a swing pivot; prone to overshooting, so never use it alone. A specialist's tool.
KST (Know Sure Thing)
Sums four different smoothed ROC periods into one "summed rate of change" oscillator, built to capture major cycle turns. The one signal: the signal-line cross above/below zero. It's a big-picture, slow momentum read for position and swing traders spotting multi-week turns. Far too slow for anything intraday.
Momentum bucket, pick one: RSI is the default and it's hard to beat. Stochastic or Williams %R if you mostly range-trade. Stoch RSI only if you scalp. TRIX/KST if you swing and hate noise. Ultimate Oscillator if single-period divergences keep faking you out. Running more than one of these is the classic beginner mistake — it's the redundancy this whole guide is warning you about.
VOLATILITY — how wide, expanding or contracting
Volatility tools don't tell you direction. They tell you the size of the field you're playing on — and, crucially, whether that field is expanding (breakout conditions) or contracting (a squeeze that precedes one). This is the bucket most traders skip, and it's the one that sizes your stops and warns you before the big move. Skipping it is why traders get stopped out by "random" noise that was never random — it was one ATR of ordinary range they didn't measure.
Bollinger Bands
A moving average with bands set two standard deviations above and below it. The bands widen when volatility rises and pinch when it falls. The one signal: the squeeze — bands contracting to a multi-week narrow flags that a large move is loading. Direction comes from the break, not the bands themselves.
Worked squeeze example. A stock ranges quietly for three weeks; the Bollinger Bands pinch to their narrowest width in 30 sessions. Volatility this low doesn't persist — it's a coiled spring. Then price closes decisively outside the upper band on volume 60% above average. That's the expansion firing, and the direction of the break is your bias. The pinch told you when; the break told you which way. You enter on the break-and-hold, stop back inside the bands, target a measured move.
The rookie trap: "price tagged the upper band, so it's overbought, short it." No. In a trend, price walks the band — it can ride the upper band up for twenty bars. A band tag is not a reversal signal any more than an overbought oscillator is. Use Bollinger in every regime: the squeeze to anticipate, the expansion to confirm, and never as a mean-reversion trigger inside a trend.
ATR (Average True Range)
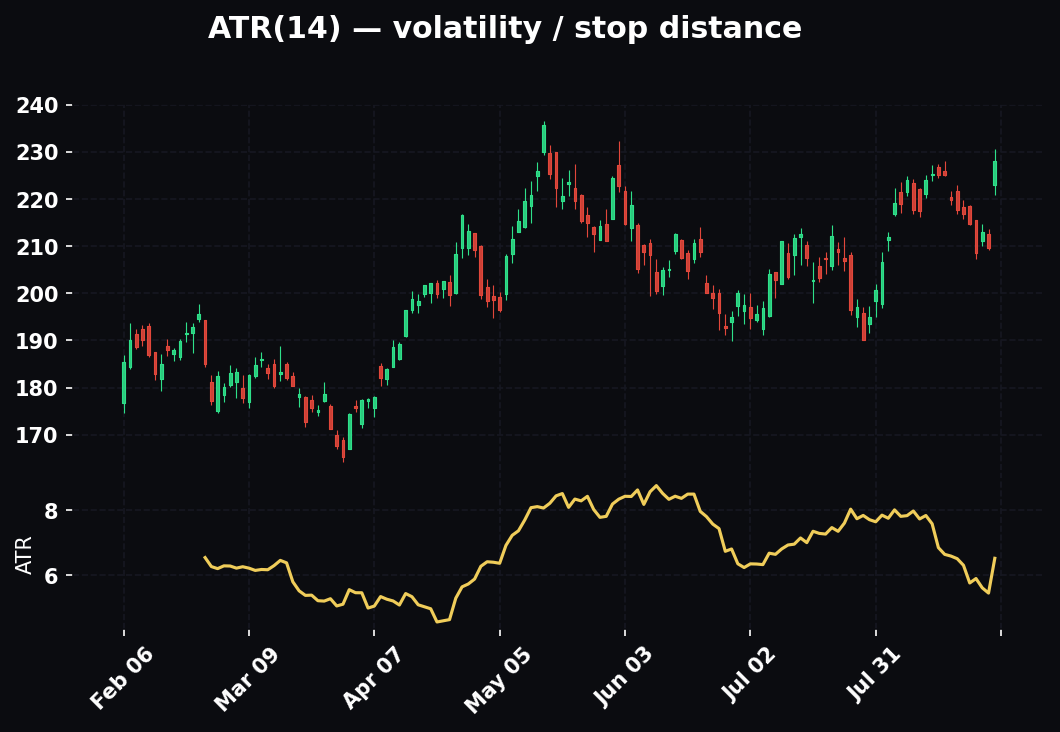
The average size of a bar's full range (including gaps) over 14 periods — a pure, directionless measure of volatility in price units. The one signal: the number itself, for sizing. This is the most important non-signaling tool on the chart and it belongs on every trader's screen permanently.
Worked sizing example. NQ's ATR on your entry timeframe reads 120 points. You want to go long at 20,400. A 30-point stop is a joke — it sits inside a quarter of one normal bar's range and will get tagged by ordinary breathing, not by your idea being wrong. Proper stop distance is a multiple of ATR: 1.5 × 120 = 180 points, placed beyond the level that actually invalidates the trade. Stop at 20,220. Now your risk is 180 points, so your minimum 1:3 target is 20,400 + 540 = 20,940. If 180 points of risk is more dollars than your plan allows, you reduce contracts, not the stop. ATR is how the 1:3 R/R gets built on real distance instead of a round number you invented because it felt comfortable. It signals nothing and it sizes everything.

Keltner Channels
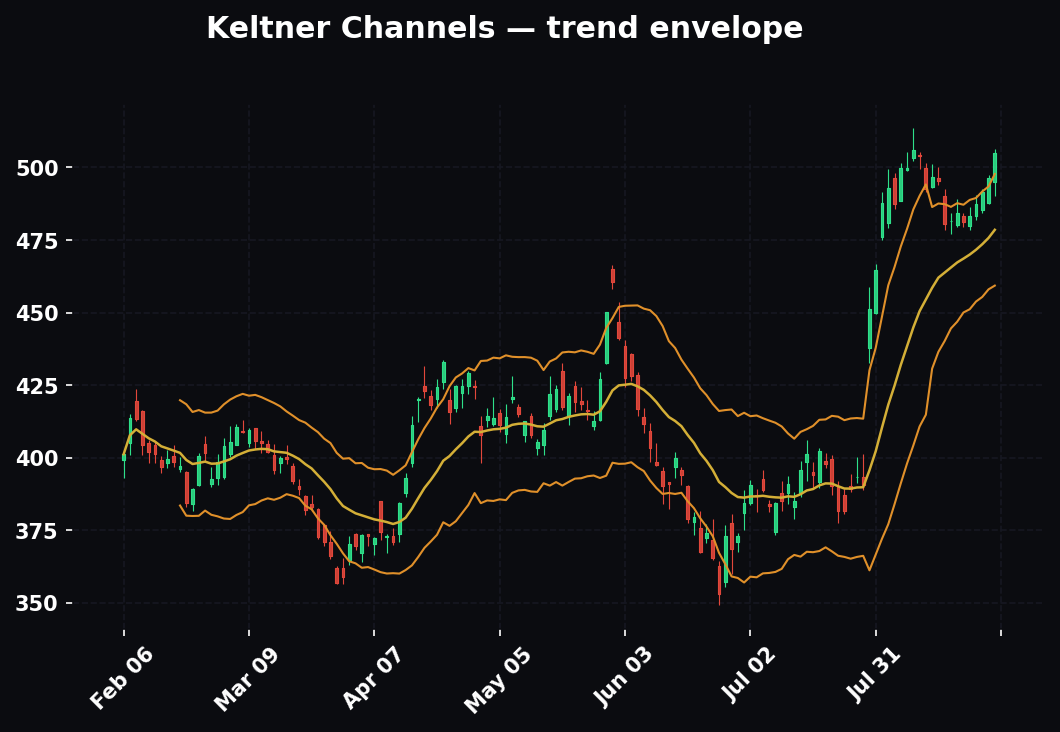
Like Bollinger Bands but the channel width is set by ATR around an EMA instead of standard deviation — so it responds to true range, not statistical spread. The one signal: a close outside the channel = a genuine trend thrust (Keltner is smoother than Bollinger, so a break means more). The famous combo: Bollinger inside Keltner = the TTM squeeze, the highest-quality volatility-compression setup there is. When the standard-deviation bands contract inside the ATR channel, volatility has compressed on both measures at once — the spring is maximally coiled. Use Keltner when Bollinger's std-dev bands feel too jumpy on your instrument, and use the Bollinger-inside-Keltner relationship as the one sanctioned two-tool stack in the volatility bucket.
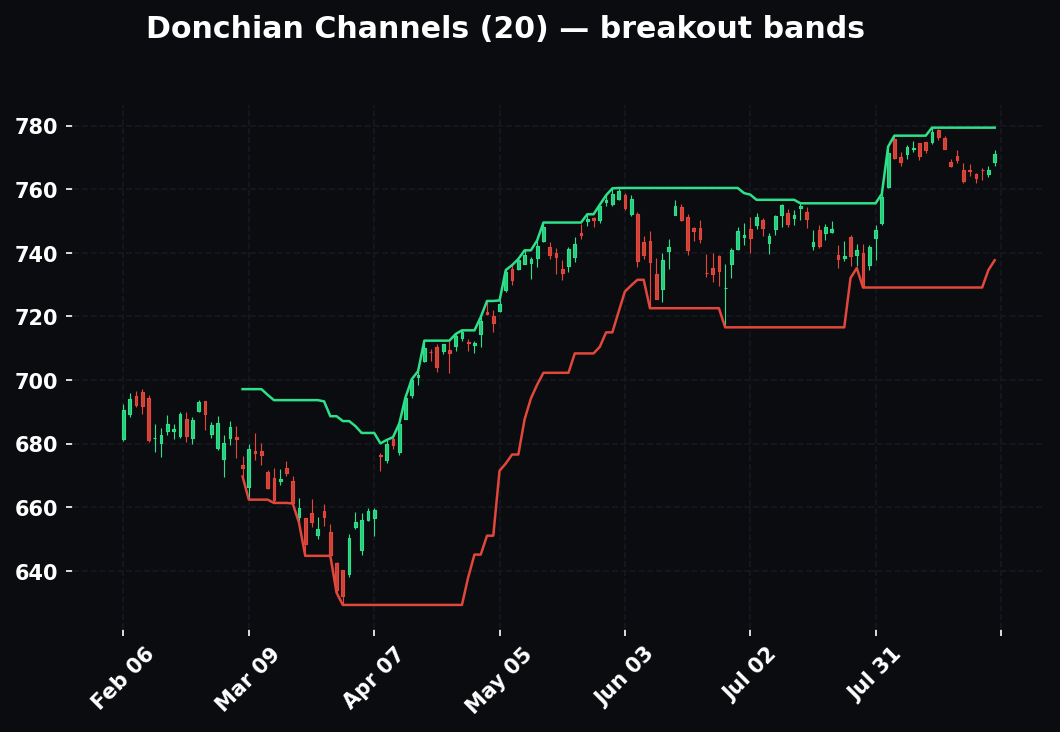
Donchian Channels
Plots the highest high and lowest low of the last N bars — the literal recent range. The one signal: a close beyond the channel = a new N-bar breakout. This is the original turtle-trading system: buy the 20-day high, trail on the 10-day low. Dead simple, mechanical, effective in trending markets. In a range it buys the top and sells the bottom, so gate it with ADX. Best for systematic trend-followers who want rules a machine could run.
Chaikin Volatility
Measures the rate of change of the spread between high and low over time — how fast the daily range is expanding or contracting. The one signal: a rapid spike = volatility is accelerating, often near a top (panic) or a breakout. Less common than ATR and it can't size a stop for you (it's a percentage, not price units), but it's a clean read on whether the market is heating up or cooling off. A supporting tool, not a primary.
Volatility bucket: ATR is mandatory for stop-sizing regardless of what else you run — treat it as always-on, and it does not count against your "one per bucket" limit because it isn't a signal tool. Then pick one channel: Bollinger to hunt squeezes, Keltner for smoother trend-thrust reads, Donchian for mechanical breakouts. Bollinger-inside-Keltner is the one place stacking two is correct, because the whole signal is the relationship between them.
VOLUME — is anyone actually behind this move
Price tells you what. Volume tells you whether to believe it. A breakout on huge volume is real participation; the same breakout on thin volume is a trap waiting to snap back. This bucket separates conviction from noise, and for intraday traders it holds the single most important line on the chart: VWAP. A note for futures traders — on instruments like NQ, "volume" is contract volume, and it's clean, deep, and worth trusting; on some FX and crypto venues volume is fragmented across exchanges and you weight these tools accordingly.
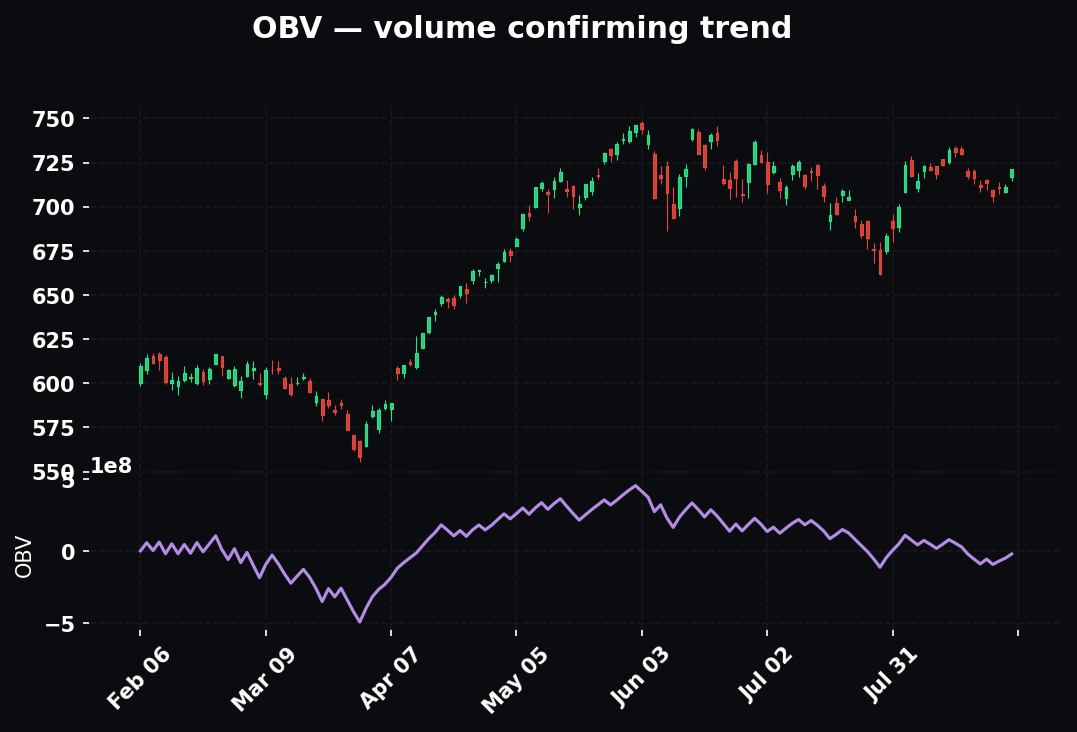
OBV (On-Balance Volume)
A running total that adds the day's volume on up-closes and subtracts it on down-closes — a cumulative measure of buying vs selling pressure. The one signal: divergence from price. Price grinds to a new high but OBV rolls over = the rally is unconfirmed, distribution underneath. OBV leading price up out of a base = accumulation before the breakout. The direction of the OBV line matters; its absolute value doesn't — never read the raw number, only the slope and the divergence. Use it to confirm breakouts and to catch hollow moves before they fail.
Volume Profile
Plots volume horizontally by price level instead of by time, showing exactly where the most business got done. The one signal: the POC (Point of Control) — the price with the most traded volume acts as a magnet and a battle line. High-volume nodes are support/resistance that price respects; low-volume gaps are areas price rips through fast. This is less an "indicator" than a map of where the levels actually live. Read it to place entries at high-volume nodes that will hold and targets across low-volume gaps that price will cover quickly. Essential for futures — the POC and value-area edges are where the day's fight happens, and price returns to the POC like a magnet more often than any oscillator will ever predict.
VWAP (Volume-Weighted Average Price)
The average price weighted by volume, reset each session — the true "fair value" line institutions benchmark against. The one signal: which side of VWAP price is on, and how it reacts to it. Above VWAP and holding it on pullbacks = bulls control the day; rejected at VWAP from below = sellers own it. It's the intraday equivalent of the daily 55 EMA — a bias line.
Worked example. NQ opens, trends up, and by 10:30 is 90 points above the session VWAP. It pulls back. The question that decides your trade: does the first touch of VWAP hold? Price fades into VWAP at, say, 20,180, wicks a hair through to 20,172, and closes back at 20,195. Bulls defended fair value. That first-touch hold is one of the cleanest intraday longs on any chart — stop just below the wick, target the prior high and beyond. If instead price slices VWAP and closes 40 points under it on rising volume, the day's character just flipped and your long thesis is dead. Mandatory for day traders; less relevant for multi-day swings, where you switch to an anchored VWAP dropped from a key event — an earnings gap, a major swing low, the year's open — to measure who's winning since that moment.
MFI (Money Flow Index)
RSI with volume baked in — a 0–100 oscillator weighting price momentum by the volume behind it. The one signal: divergence, weighted by real money. An MFI divergence carries more evidence than a plain RSI one because thin-volume moves get discounted automatically — a "higher high" made on no volume barely moves MFI, so the divergence shows up honest. Use it as your momentum tool when you specifically want volume in the reading — it's a two-bucket tool (momentum and volume in one line), which makes it genuinely efficient rather than redundant. Overbought/oversold at 80/20.
Chaikin Money Flow (CMF)
Measures buying vs selling pressure over ~21 bars using where each close lands within its range, weighted by volume, oscillating around zero. The one signal: the zero-line side — sustained above zero = accumulation, below = distribution. A slower, steadier read of institutional flow than OBV's tick-by-tick line. Use to confirm the character of a trend: a rally holding CMF > 0 has real money behind it; a rally with CMF sliding under zero is being sold into and is living on borrowed time.
Accumulation/Distribution (A/D Line)
A cumulative line, cousin to OBV, but it weights each bar by where the close finished within the bar's range rather than just up/down — so a close on the highs on big volume counts heavily and a close in the middle counts for little. The one signal: divergence. A/D rising while price stalls flags hidden accumulation. More nuanced than OBV because it reads the quality of each bar, not just its direction. Use it the same way you'd use OBV when you want that extra nuance — but pick one, not both.
Force Index / Elder Ray
Force Index multiplies price change by volume to measure the power behind each move; Elder Ray splits it into Bull Power and Bear Power around an EMA. The one signal: spikes and divergences — a huge Force Index spike marks climactic buying/selling (often exhaustion); divergence flags a fading move. Part of Elder's "triple screen" system. Use it to gauge whether a push has real muscle or is running on fumes.
Volume bucket, pick one (day traders: two): VWAP is non-negotiable for intraday — it's your bias line. Add OBV or A/D for breakout confirmation via divergence. MFI is the efficient choice if you want your momentum and volume in one tool. Volume Profile stands somewhat apart — it's a map of where levels live, and it pairs with everything.
Multi-timeframe: the same tool says different things on different clocks
An indicator's reading is only as meaningful as the timeframe it's on, and the biggest un-forced error after redundancy is reading one clock in isolation. The rule: higher timeframe sets the bias, lower timeframe times the entry, and you never trade against the higher one.
Concrete stack. The daily sets your bias — daily EMA 12/22/55 and the daily 55 slope tell you long-only or short-only, and daily ADX tells you whether a trend even exists to trade. The 1H or 15m finds the setup within that bias — the pullback to a rising EMA, the VWAP touch, the squeeze. The 1m or 5m times the trigger — the RSI hook, the reclaim of VWAP, the break-and-hold. When all three align — daily up, 15m pulling back into support, 1m hooking up on volume — that's a top-tier trade. When they conflict — daily up but 1m ripping straight down — you wait, because a 1m signal against a daily trend is a scalp at best and a trap at worst.
The classic MTF failure: a beautiful 1-minute RSI-oversold-bounce long, taken straight into a falling daily 55 EMA. The 1m signal was real. It was also irrelevant, because the daily said sellers own this and the bounce was just a lower high forming. Signals inherit the authority of their timeframe. A daily divergence outranks a 5-minute divergence every time they disagree.
Confluence done right: combining three buckets on one trade
Real confluence is three independent buckets agreeing at a level that matters. Here's the anatomy of an A+ long, built from the four buckets working as designed rather than four momentum tools nodding along.
The setup. NQ, daily uptrend, daily 55 EMA rising underneath, daily ADX at 31 — trend confirmed, long-only playbook loaded (trend bucket + regime filter). Price pulls back on the 15m into a confluence zone: the rising 22 EMA at 20,290 sits right on top of the prior-day Volume Profile POC at 20,285 and the session VWAP at 20,288. Three different tools pointing at the same 5-point pocket — that's a level that matters, not a line you drew because it looked nice.
The trigger. On the 1m, price wicks into 20,283 and closes back at 20,306. RSI hooks up off 44 (momentum bucket, continuation read in a trend). OBV, which had been flat through the pullback, ticks up as price reclaims — volume confirming the reclaim, not fading it (volume bucket).
The sizing. ATR on the 15m is 130. Stop goes 1.5 × ATR below the confluence zone, beneath the level that would break the structure: 20,90-ish, call it 20,090. Risk from entry 20,306 is ~216 points. Minimum target 20,306 + 648 = 20,954, and there's a prior high and a low-volume gap above pointing there. Trend, momentum, volatility and volume each did their own job. That's four votes, not one vote four times. That's the difference this whole guide exists to teach.
How indicators behave in each regime
Every tool on this list has a regime where it sings and a regime where it lies. Know which you're in — that's ADX's job — before you interpret anything.
Trend regime (ADX > 25, rising). Trend tools are king: EMA stack holds, Supertrend trails clean, MACD stays on one side. Oscillators flip meaning — overbought is strength, the 40/60 pivot replaces 30/70, and fading extremes is a fast way to lose. Bollinger price walks the band. VWAP holds on first touch. Trade with the direction, buy pullbacks, let winners run wide, trail don't target-cap.
Chop / range regime (ADX < 20, flat). Trend tools are landmines — every EMA cross and Supertrend flip is a whipsaw. This is oscillator season: Stochastic and Williams %R fade the extremes, RSI 30/70 works again, price mean-reverts to VWAP and the Volume Profile POC. Take profit fast at the opposite edge, never let a range-fade "run" — the edge is the exit.
High-volatility regime (ATR spiking, often on news). Everything gets noisier and stops must get wider — a stop that was fine yesterday is inside the noise today because ATR doubled. Reduce size to keep dollar risk constant. Divergences become unreliable in the chaos; Bollinger and Keltner blow out; VWAP whips. The correct move is usually smaller and slower, not clever. Many pros simply stand aside for the first fifteen minutes after a major econ print and let the ATR settle before they trust any signal.

How the pros use these differently from beginners
The tools are identical. The relationship to the tools is opposite.
Beginners collect; pros subtract. A beginner's chart grows every month as each new "the one that finally works" gets added on top. A pro's chart shrinks toward four clean tools and then stops. The pro has learned the hard lesson that more inputs mean less clarity, not more edge.
Beginners want signals; pros want context. A beginner asks "is this a buy?" and wants the indicator to answer. A pro uses the indicator to frame a decision the price is making — the tool describes the field, the trader makes the call. No indicator ever "tells the pro to buy."
Beginners read one timeframe; pros read the stack. The beginner takes the 5-minute signal at face value. The pro checks the daily bias first and throws away any signal that fights it.
Beginners treat overbought as a reversal; pros know it depends on regime. This one line separates the accounts that grow from the ones that bleed. The pro checks ADX before deciding whether "overbought" means reverse or press.
Beginners move stops; pros move size. When ATR says the proper stop is uncomfortably wide, the beginner tightens the stop into the noise and gets tagged. The pro keeps the stop where the chart says and cuts the position size to fit the risk. Same dollar risk, correct stop location.
Beginners hunt the perfect indicator; pros perfected risk long ago. The pro knows the edge was never in the tool. It's in demanding 1:3, sizing to ATR, respecting the higher-timeframe bias, and standing down when the regime is wrong. The indicators just organize the decision.
Beginners believe the indicator; pros believe the level. Price at a Volume Profile POC that also lines up with VWAP and a rising EMA — the level is the trade. The oscillator hook is just the green light to act on a level that was already there.
The common mistakes that burn everyone
1. Stacking within a bucket. RSI + Stochastic + CCI + Williams %R is one signal, four times. It manufactures fake confluence and inflates your size at exactly the wrong moment. One per bucket, always.
2. Fading strong trends on "overbought." Overbought is not a sell signal in an uptrend — it's proof the trend is strong. Oscillators are reversal tools in ranges and continuation tools in trends. Call the regime first.
3. Using lagging tools to time entries. Moving averages, MACD, and Ichimoku lag by construction. They set bias; they don't time the click. Time entries with price at a level, confirmed by momentum and volume.
4. Ignoring volatility, then getting stopped for no reason. A stop set without ATR is a stop set inside the noise. Size the stop to the instrument's true range, not to a dollar amount you happen to be comfortable losing.
5. Confusing an indicator for a system. No indicator is an edge by itself. The edge is the combination — trend agrees with momentum agrees with volume, at a level that matters, with a stop that respects volatility and a target at least 3× the risk.
6. Reading a single timeframe in isolation. A 1-minute signal against a daily trend is a trap with a pretty face. Bias comes from the higher timeframe; the lower one only times entries inside that bias.
7. Over-optimizing settings. Endlessly tweaking RSI from 14 to 11 to 17 to "make it work" is curve-fitting the past. The default periods are fine. Your problem is never the length input; it's the regime read or the risk.
8. Trading the indicator instead of the price. The candles are the truth; the indicator is a derived summary of them. When they disagree — price breaks a key level but the oscillator "says no" — believe the price. The indicator is downstream.
9. Treating divergence as a timing signal. Divergence says the current leg is tired; it does not say a reversal starts now. Momentum can diverge for many bars while price keeps grinding. Use it to tighten and prepare, not to fire a countertrend trade blind.
10. Forgetting volume on breakouts. A breakout without a volume expansion is a fake-out in progress. If OBV/VWAP/volume don't confirm participation, the level probably won't hold. Believe breakouts that bring their volume; fade the ones that don't.
11. Running trend tools in chop without a filter. Supertrend, SAR, Donchian, MA crosses — all of them shred you in a range. Gate every trend-follow tool behind ADX > 25 so you only deploy them where they work.
12. Mistaking indicator agreement for order-flow truth. Indicators are transforms of the same OHLCV. Their agreement is real only when they measure different dimensions. Four momentum tools agreeing tells you nothing about volume, volatility, or trend — the three things that would actually confirm the trade.
The playbook — how to actually build your chart Monday morning
- Set bias with trend. Daily EMA 12/22/55. Price above a rising 55 = long bias only. Below a falling 55 = short bias only. Confirm a real trend exists with ADX > 25. If ADX is under 20, switch to range tactics or stand down.
- Time the entry with momentum. Wait for price to pull back to a rising EMA or a Volume Profile / VWAP level, then take the RSI hook up out of the 40–50 zone (in an uptrend). Divergence against you = don't take it.
- Confirm with volume. OBV or VWAP should agree — price reclaiming VWAP or OBV pushing to new highs with the move. Hollow volume = pass.
- Size with volatility. Set the stop beyond 1.5× ATR from entry, past the level that invalidates the idea. Measure the distance. Target a minimum of 3× that distance — 1:3 R/R or you don't take the trade.
- Trail and bank. Trail with Supertrend, SAR, or the moving average once you're 1R in profit. The levels do the work; discipline banks it.

FAQ
Which indicators should a complete beginner start with? Exactly four: EMA 12/22/55 (trend), RSI (momentum), ATR (volatility), VWAP (volume, intraday). Trade only those for three months. You'll learn more from four tools you understand deeply than forty you glance at.
Is there a single "best" indicator? No — the question is a category error. The best indicator is whichever fills the bucket you're currently blind in. A trend tool can't confirm a trend tool; you need a different dimension.
Do indicators work on all timeframes? The math works on any timeframe, but the reliability doesn't. Oscillators on the 1-minute are mostly noise; trend tools on the 1-minute whipsaw. The higher the timeframe, the more trustworthy the signal, and the fewer of them there are.
Should I change the default settings? Almost never. 14-period RSI, 14-period ATR, 12/26/9 MACD — these defaults are what everyone else watches, which is part of why they work. Chasing custom settings is usually a way to avoid fixing your risk or your regime read.
Why did my indicator signal work last week and fail this week? Almost always because the regime changed and you didn't. The same overbought reading means "reverse" in a range and "press" in a trend. Check ADX before you interpret any oscillator.
Do lagging indicators actually help if they're always late? Yes — for bias and trailing, which is what they're for. You don't ask a moving average to time your entry; you ask it which direction you're allowed to trade and where to trail. Used that way, the lag is a feature.
Leading vs lagging — which should I trust? Neither in isolation. Lagging tools (MAs, MACD, Ichimoku) set bias. "Leading" tools (oscillators, some volume tools) time entries and flag exhaustion. They're a division of labor, not a competition.
How many indicators is too many? More than one per bucket is too many, with the three named exceptions (ADX alongside trend, Bollinger-inside-Keltner, VWAP-plus-one-volume-line). If your chart has two momentum oscillators on it, delete one now.
Where does price action fit with all this? Price action is the source; indicators are summaries of it. When price and an indicator disagree, price wins. Use indicators to organize what the candles are already telling you, not to overrule them.
What about the daily 55 EMA specifically — why that line? Because it's slow enough to ignore intraday noise but responsive enough to bend inside a real trend change, and it's the line Hollow Point uses as the master bias tell. Above a rising daily 55, you're a buyer. Below a falling one, you're a seller. Everything else is timing.
Quick-reference cheat-sheet
| Indicator | Bucket | The one signal | Best regime |
|---|---|---|---|
| EMA/SMA stack | Trend | Stack + slope; hold of rising EMA | Trending |
| MACD | Trend | Histogram divergence | Swing/trend |
| ADX/DMI | Trend | >25 rising = real trend | Regime filter |
| Ichimoku | Trend | Price vs cloud | Higher-TF bias |
| Parabolic SAR | Trend | Dot flip (as trailing stop) | Established trend |
| Supertrend | Trend | Flip on close | Trend-follow |
| Aroon | Trend | Up>70, Down<30 = young trend | Trend onset |
| Vortex | Trend | VI+/VI− cross | Trend change |
| RSI | Momentum | Divergence + 40/60 pivot | All (default) |
| Stochastic | Momentum | %K/%D cross in extremes | Range |
| Stoch RSI | Momentum | Turn out of 0/100 | Intraday scalp |
| CCI | Momentum | Cross back inside ±100 | Commodities/futures |
| Williams %R | Momentum | Turn out of −80/−20 | Range |
| ROC | Momentum | Zero cross + divergence | Breakout thrust |
| Ultimate Osc | Momentum | Confirmed divergence | Anti-fakeout |
| TRIX | Momentum | Zero-line cross | Swing (low noise) |
| Fisher Transform | Momentum | Reversal spike | Pivot confirm |
| KST | Momentum | Signal cross | Position/cycle |
| Bollinger Bands | Volatility | The squeeze | All |
| ATR | Volatility | The number, for stops | Always on |
| Keltner | Volatility | Close outside channel | Trend thrust |
| Donchian | Volatility | N-bar breakout | Mechanical trend |
| Chaikin Volatility | Volatility | Expansion spike | Heat check |
| OBV | Volume | Divergence | Breakout confirm |
| Volume Profile | Volume | POC / nodes | Levels (all) |
| VWAP | Volume | Which side price holds | Intraday (must-have) |
| MFI | Volume | Volume-weighted divergence | Momentum+volume |
| CMF | Volume | Zero-line side | Trend character |
| A/D Line | Volume | Divergence | Breakout confirm |
| Force Index/Elder Ray | Volume | Spike / divergence | Exhaustion |
One-line rules to tape to your monitor
- One indicator per bucket. Substitute, don't stack.
- Trend sets bias, momentum times entry, volatility sizes the stop, volume confirms.
- Call the regime with ADX before you read any oscillator.
- Overbought is reversal in a range, strength in a trend.
- Higher timeframe wins every disagreement.
- Move size, not stops, to fit your risk.
- ATR sizes the stop; the level sets the target; 1:3 or no trade.
- Price is the truth; the indicator is a summary. Believe the price.
- Divergence tightens and prepares; it doesn't fire a trade.
- Above a rising daily 55, you're a buyer. Below a falling one, you're a seller.
Thirty tools, four questions: Which way? How fast? How wide? Who's behind it? Answer all four with one clean indicator each and you'll out-read the trader running twelve. Master the four buckets, respect the daily 55, size to ATR, demand 1:3, and let the levels do the work.
Bound by rules, feared by trade.