
Fibonacci gets treated like magic or like garbage, and both camps are wrong. The mystics draw a dozen fibs on every chart and pretend the market bows to a medieval number sequence. The skeptics see the mystics, roll their eyes, and throw the whole tool in the trash. The truth sits between them, and it's more useful than either side admits: Fibonacci isn't magic, and it isn't noise. It's a map of where a pullback becomes a trap — a way to pre-mark the exact prices where the last batch of buyers or sellers will make their stand. It works because everyone can see it, and it fails the instant you force it onto a swing that isn't there.
This guide is the whole thing, front to back, nothing hand-waved. What the ratios are and where they physically come from. How to pick the correct swing to measure — the single skill that separates fibs that work from fibs that embarrass you in front of your own account. The golden pocket, and why the 0.618–0.65 band is the highest-probability reclaim-or-reject zone on any chart. Extensions as profit targets you actually bank. How the tool behaves in a trend versus chop versus a high-volatility news day, because it is not the same tool in all three. How to run it across timeframes so a five-minute line never overrules a daily one. How to stack fibs with EMAs, VWAP, volume profile, and prior structure so you're never trading a lonely line. And the mistakes — the wrong-leg draw, the forced fit, the context blindness, the touch-chaser — that quietly shred more accounts than any other single tool on the platform.
By the end you'll be able to draw one Monday morning at 8:28am, read it in ten seconds, and know precisely where you're wrong and how much you're risking to find out.

What Fibonacci Actually Is
Start with the sequence, because the ratios fall straight out of it and you should never trade a number you can't derive. Leonardo of Pisa — nicknamed "Fibonacci" — popularized it in Europe in 1202 in a book about, of all things, rabbit population growth. You build the sequence by adding the two previous numbers:
0, 1, 1, 2, 3, 5, 8, 13, 21, 34, 55, 89, 144, 233, 377, 610...
The magic isn't the numbers themselves. It's the relationships between them, and those relationships are what you plot on a chart. Divide any number by the one immediately after it and, as the numbers grow, you converge on 0.618. Try it: 34 ÷ 55 = 0.618, 89 ÷ 144 = 0.618, 233 ÷ 377 = 0.618. Divide a number by the one two places ahead and you get 0.382 (55 ÷ 144 = 0.382). Three places ahead gives 0.236 (34 ÷ 144 = 0.236). Now flip the division — divide a number by the one before it — and you converge on 1.618, the "golden ratio," written as the Greek letter phi (φ). Square roots and simple combinations produce the rest: 0.786 is the square root of 0.618, 0.5 is just the plain midpoint (not a true Fibonacci ratio, but it earns its keep), and 1.272 is the square root of 1.618.
The full ratio set and what each one is telling you
Here is the toolkit you'll actually use, and — more importantly — what each level means as a description of a pullback's health:
- 0.236 — a shallow retracement. A pullback this small means the trend barely paused to breathe. This is strong-trend, momentum territory; a bounce from 0.236 says buyers are almost frantic to get back in.
- 0.382 — the first meaningful pullback. Strong, orderly trends very often bounce here and never look back. If price holds 0.382, you are usually still in a powerful trend.
- 0.5 — the midpoint. Not a Fibonacci ratio at all, mathematically, but psychologically enormous because humans instinctively watch halves, and it earns its spot on the tool by sheer crowd behavior.
- 0.618 — the golden ratio. The top edge of the golden pocket. The single most-watched retracement price in all of trading, bar none.
- 0.65 — the bottom edge of the golden pocket. Some traders use 0.66 or the 0.66-adjacent 0.667; HPT standardizes on 0.65.
- 0.786 — the deep retracement. The last stop before a full failure. A bounce from here is a "deep discount" reclaim, bought against maximum fear.
- 1.0 — a full retracement. The entire prior move is given back. Price is sitting on the swing point that started everything.
- 1.272, 1.414, 1.618, 2.0, 2.618 — extensions. These live beyond the original move and become your profit targets, not your entries.
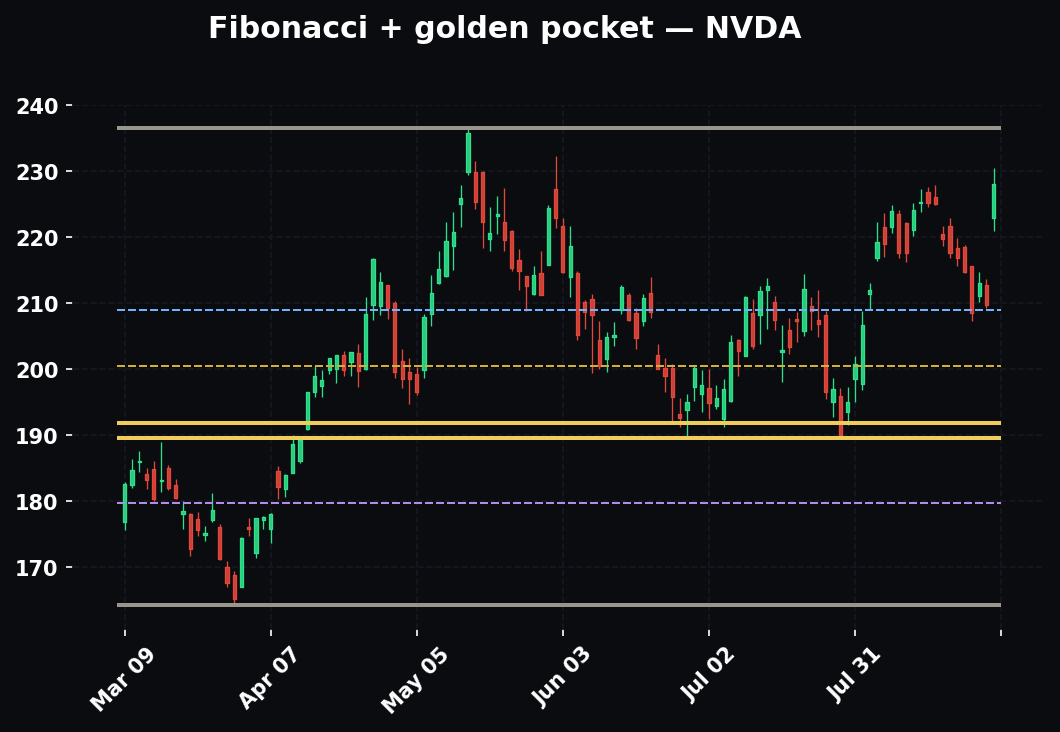
That's the whole vocabulary. Now the part nobody bothers to explain, and the part that decides whether you use this tool with conviction or with superstition: why any of this moves price at all.
The Mechanism — Why Fib Levels Actually Work
Fibonacci does not work because the universe is secretly coded in phi, and if anyone tells you that, close the tab. It works because it is a self-fulfilling coordination point layered on top of genuine order-flow behavior. Two distinct things are happening at the same price at the same time, and you need to hold both in your head.
The reflexive layer — coordination
Millions of retail traders and every serious institutional desk have the identical fib tool sitting on the identical obvious swing. When price pulls back into 0.618, a wall of resting orders is already parked there before price arrives: limit buys from people who wanted "a pullback into the golden pocket," protective stops from traders who got short into the move, and execution algos programmed to react to that exact price band. The level works because enough participants believe it works and pre-position around it. That is not a knock on the tool — it's how every level on every chart works, fib or not. A prior day's high is "just a line" too, until you realize thousands of orders cluster at it. Coordination creates the reaction. Fibonacci is simply an unusually widely-shared coordination scheme.
The structural layer — the anatomy of a real pullback
This is the deeper and more durable reason, and it's why fibs keep working even as the crowd rotates. Fib levels measure the emotional anatomy of a trapped market. Every impulse move manufactures trapped participants. Say price rips from 100 to 110. The people who bought at 108 and 109 — the late longs — are now offside the second it pulls back. The people who missed the whole move are sitting on their hands waiting to get in "on a dip." Now watch what each retracement depth does to those two crowds:
- A pullback to 0.382 (about 106.20) is a shallow dip. The missed-the-move crowd pounces fast, the late longs barely feel any pain, and the trend resumes almost immediately. Shallow retrace = powerful trend.
- A pullback to 0.618–0.65 (about 103.80–103.50) is a real discount. The late longs are sweating and some are bailing, the weak hands are getting flushed, but the structure of the trend is still intact. Patient buyers who wanted a genuine pullback are now getting filled.
- A pullback all the way to 0.786 (about 102.14) means the late longs are deeply underwater and puking their positions, and price is offering a fat discount against maximum fear. If buyers show up there and hold it, they are showing up with real conviction — but you're now one bad candle from a full trend failure.
The fib ratios are nothing more than a ruler laid across that emotional gradient. That's the honest, mechanical explanation, and it's why the tool survives.
The golden pocket sits precisely in the sweet spot: deep enough to shake out the weak hands and fill the patient buyers, shallow enough that the trend's structure hasn't broken. That single sentence is the entire reason it's the highest-probability zone on the chart, and everything downstream in this guide is a consequence of it.
Drawing a Retracement — Leg Selection Is the Entire Game
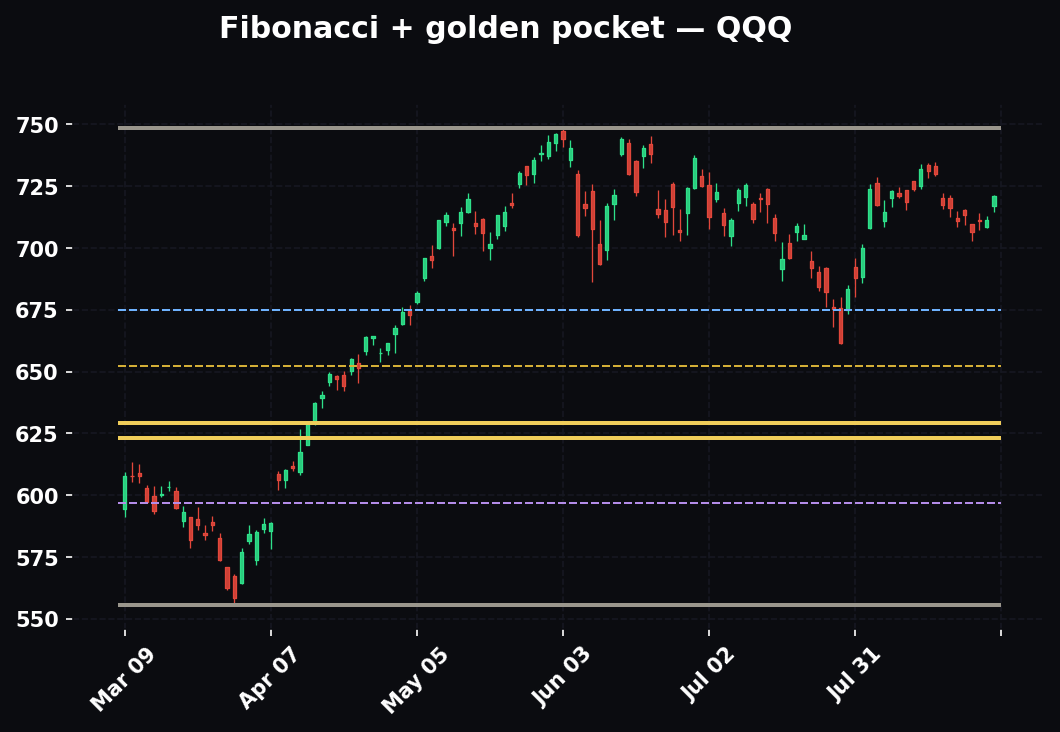
Here is the truth most tutorials bury under twenty screenshots of the tool menu: the fib tool is trivial to operate and dangerously easy to draw wrong. The tool itself is two clicks — swing low to swing high in an uptrend, swing high to swing low in a downtrend — and it auto-plots every ratio in between. Ten seconds, and a child could do it. The skill was never in the clicking. The skill is choosing which swing to measure. Draw it on the wrong leg and every level it prints is fiction, dressed up in official-looking numbers that give you false confidence right before they cost you money.
The one rule: measure the impulse, not the noise
An impulse — a "leg" — is a clean, decisive, directional move where the market is visibly committing: big-bodied candles, minimal overlap, one clear direction. You want to anchor from the swing low that started that move to the swing high that ended it (uptrend), and then let the retracement levels project onto the pullback that follows. Reverse everything for a downtrend: the swing high that started the drop, down to the swing low that ended it.
The step-by-step, in order
- Set the trend on your timeframe first. Use structure — higher highs and higher lows is an uptrend; lower highs and lower lows is a downtrend. HPT's fastest tell is the EMA stack: 12 over 22 over 55 with price above the 55 is an uptrend; the mirror image is a downtrend; tangled EMAs mean no trend and no fib trade. Do not draw a retracement until you know which way the tide runs, because a fib in a trendless market is just a decoration.
- Find the most recent completed impulse leg. Not the entire year of price action — the last clean push that hasn't already been fully retraced. The swing points should be obvious*. If you're squinting and hovering the cursor trying to decide where the swing low "really" is, the swing is too messy to fib. Obviousness is a feature, not a coincidence: an obvious swing is one the whole market also sees, which is exactly what makes the levels coordinate.
- Anchor low-to-high (up) or high-to-low (down). In an uptrend, 0.0 sits at the top (the swing high) and 1.0 at the bottom (the swing low), so the retracement levels count down into the pullback. TradingView orients it automatically once you drag in the correct direction; if your levels look upside-down, you dragged the wrong way.
- Read where price is right now relative to the levels — approaching the pocket, sitting inside it, or already rejected from it. This is a status check, not a prediction.
How to actually identify a swing point
A valid swing high is a candle whose high is higher than the candles on both sides of it — a local peak the market turned away from. A valid swing low is the inverse. The stronger the swing, the more candles on each side confirm it and the more decisively price left the level. For fib purposes, prefer swings that (a) print a clear reversal candle or cluster, (b) are followed by a real move away, and (c) line up with a level you'd have drawn anyway. A swing that only becomes "a swing" after you've drawn three fibs to find one is not a swing — it's you fitting the tool to a wish.
The two clicks are nothing. The judgment in step 2 is everything. A good swing to fib has a clear origin, a clear end, and a pullback that is actually underway or clearly setting up. If any one of those three is fuzzy, you don't have a fib setup — you have a chart you want to have a fib setup, which is a completely different and much more expensive thing.

The Golden Pocket — 0.618 to 0.65
The golden pocket is the narrow band between the 0.618 and 0.65 retracement levels. This is the zone HPT treats as the single highest-probability reclaim-or-reject area on any chart, and it earns its own long section because it is where the large majority of your actual trades will trigger.
Why this exact band and not some other level
Combine the two mechanisms from earlier. The 0.618 is the most-watched single price on the chart, so resting orders cluster there by reflex — that's the coordination layer. And a 61.8%–65% pullback is the deepest a healthy trend typically retraces before continuing — go much past 0.65 and you're flirting with 0.786 and a genuine trend failure — that's the structural layer. So the pocket is the precise price zone where two independent things overlap: maximum resting liquidity and maximum "the trend is still valid but you are finally getting a real discount." That overlap is why reactions there are sharp, fast, and tradeable, while a reaction at 0.382 is often too shallow to give you a clean entry and a reaction at 0.786 is often too close to failure to trust.
The binary read — the pocket's real gift
The pocket hands you a binary decision framework, and that clarity is what makes it so valuable to a disciplined trader:
- Reclaim — price trades into the pocket, finds buyers (in an uptrend), and reclaims the level with a strong close back out of it. The trend resumes. This is your continuation entry.
- Reject — price trades into the pocket, fails to hold, and closes back through it in the opposite direction. The trend is now suspect, and a reject frequently signals a full reversal toward 0.786 and then 1.0.
The pocket does not tell you which outcome will happen in advance — and any tool that claims to is lying. It tells you where to watch and what each outcome means. You wait for the candle to show its hand. In an uptrend, a long lower wick and a strong close up out of the pocket is a reclaim; a weak-bodied candle that slices straight through and closes below is a reject. You trade the reaction, never the arrival.
The clean invalidation — why the pros love it
The stop placement is surgical, and this is the pocket's best structural gift. In an uptrend, your invalidation sits just below the 0.786 (or just below the pocket itself if you're trading aggressively). Your entry is inside the pocket. Your target is the prior swing high and then the extensions above it. That geometry frequently builds a 1:3 reward-to-risk ratio directly into the setup — a small distance from entry to the invalidation, and a multiple of that distance to the extension targets. That is not a happy accident. It is the entire reason HPT leans on the pocket so heavily: the levels do the geometric work, and discipline banks the result. When the math of a setup hands you 1:3 before you've done anything clever, your only job is to not get in the way of it.

Worked Example 1 — A Long Off the Pocket in a Trend
Numbers make this real, so let's build one bar by bar. Say NQ (Nasdaq futures) puts in a clean impulse leg on the 15-minute: swing low at 20,000, swing high at 20,500 — a 500-point leg with big green bodies and almost no overlap. Textbook impulse. Price now rolls over and starts pulling back, and you want to know where to hunt a long continuation.
Anchor the fib from 20,000 (1.0, bottom) to 20,500 (0.0, top). The tool prints:
- 0.236 → 20,382
- 0.382 → 20,309
- 0.5 → 20,250
- 0.618 → 20,191 ← top of pocket
- 0.65 → 20,175 ← bottom of pocket
- 0.786 → 20,107
- 1.0 → 20,000 (invalidation of the entire leg)
Your golden pocket is 20,175–20,191. Now you wait, and waiting is the hard part. Price drifts down over the next hour and taps 20,185 — inside the pocket. You do nothing yet, because a touch is not a signal. The 5-minute candle that touches the pocket prints a long lower wick down to 20,178 and closes at 20,205, back above the 0.618. That's a reclaim.
- Entry: ~20,205 on the reclaim close.
- Stop: below the 0.786 at 20,107 — say 20,090. Risk ≈ 115 points.
- Target 1: the prior high, 20,500 (+295 points).
- Target 2: the 1.272 extension at 20,636 and the 1.618 at 20,809.
Risk 115 points to make ~295 to the swing high alone — that's already 1:2.5, and it opens well past 1:3 if the extensions fill. Textbook golden-pocket long. Notice what actually did the work: you predicted nothing. You marked the zone, waited for the candle, and let a pre-defined level and a pre-defined invalidation build the entire trade for you.
The reject version, for contrast
Same leg, same levels, different candle. The candle that hits 20,185 closes at 20,150 — below the pocket — and the next candle confirms under 0.65, closing 20,130. No long. Now you flip your attention downward: a rejection from the pocket points at 0.786 (20,107) and a possible full failure to 20,000. Same map, opposite read, and you never took a losing long because you waited for the close. The pocket told you where; the candle told you which. That is the whole relationship between the tool and the tape.
Worked Example 2 — A Short Off the Pocket in a Downtrend
Fibs are direction-agnostic, so let's do the mirror image to cement it. SPY is in a clear daily downtrend — lower highs, lower lows, price under a downward-sloping 55 EMA. An impulse leg drops from a swing high at 540 to a swing low at 528 — a 12-point leg down. Price now bounces, and you want a short continuation.
Anchor high-to-low: 540 (0.0, top) down to 528 (1.0, bottom). In a downtrend the retracement levels project up into the bounce:
- 0.382 → 532.58
- 0.5 → 534.00
- 0.618 → 535.42 ← bottom of pocket (because we're inverted)
- 0.65 → 535.80 ← top of pocket
- 0.786 → 537.43
Your pocket is 535.42–535.80. Price bounces and pushes into 535.60, right in the pocket, on declining volume. The daily 55 EMA happens to sit at 535.50 — confluence. The reaction candle is a shooting star: long upper wick to 536.10, close back at 534.90, below the pocket. That's a reject of the bounce = short continuation.
- Entry: ~534.90 on the reject close.
- Stop: above the 0.786 at 537.43 — say 537.60. Risk ≈ 2.70.
- Target 1: the prior low, 528.00 (−6.90).
- Target 2: the 1.272 extension at 524.72 and the 1.618 at 520.58.
Risk 2.70 to make 6.90 to the prior low alone — 1:2.5, and better into the extensions. Identical logic, opposite direction. The only thing you inverted was which way you dragged the tool.

Extensions — Where the Move Goes, Not Where It Stops
Retracements measure the pullback. Extensions measure where price travels after the pullback resolves — they live beyond the 1.0 and become your targets, never your entries.
The extensions that matter
- 1.272 — the first extension target, the square root of 1.618. Conservative and very often the first place a continuation move pauses. This is where you take your first partial, almost always.
- 1.414 — the square root of 2. A minor level, useful mainly as a checkpoint between 1.272 and 1.618.
- 1.618 — the golden extension. The most common measured-move target on the chart and where a very large number of moves genuinely exhaust. If you take only one extension target, take this one.
- 2.0 — a 100% measured move (the next leg equals the first leg). Clean and intuitive; strong trends blow through it, weak ones stall before it.
- 2.618 — the extended target for powerful, running trends. The far marker for a move that's really going.
Two ways to plot them, and when to use each
Retracement-tool extensions (the simple version). The same fib retracement tool already prints 1.272 and 1.618 beyond your swing high in an uptrend, if you enable those levels in the tool's settings. In Worked Example 1, the 1.618 landed at 20,809. If price reclaims the pocket and breaks the prior high, that becomes your next magnet with zero extra effort. Use this version for everyday continuation trades — it's fast and it's good enough.
The trend-based (three-point) extension (the precise version). You click three points: the start of the impulse, the end of the impulse, and the end of the retracement (the pocket low where you entered). This projects the next leg as a multiple of the first leg, measured from the pullback low. It answers a more precise question: "if this pattern repeats its own proportions, where does the next leg actually end?" Use the three-point tool when you want cleaner targets on a high-conviction continuation trade, or when the simple extension and the structure disagree and you want a tiebreaker.
The one discipline that matters with extensions
Either way, the rule is identical: extensions are where you take profit, not where you enter. You scale out into 1.272 and 1.618 rather than staring at the screen hoping to nail the exact top. Marrying a pocket entry to extension exits is precisely how the 1:3 gets built and then banked instead of round-tripped back to breakeven because you got greedy at 1.272 waiting for 2.618.

How Fibonacci Behaves in Different Market Regimes
This is the section most guides skip, and skipping it is why people think the tool is "unreliable." The tool isn't unreliable — it's a trend instrument, and its behavior changes completely with the regime. Same fib, three different animals.
In a clean trend — the fib's home turf
This is where everything above applies exactly as written. Pullbacks respect the levels, the golden pocket produces sharp reactions, extensions get hit, and the reclaim/reject read is reliable. In a strong trend, retracements tend to be shallow — 0.382 and 0.5 do a lot of the reclaiming, and price may never reach the pocket at all. That's information: if a market keeps bouncing at 0.382 and never gives you the pocket, the trend is strong and you should be buying the shallow dips, not holding out for a discount that isn't coming. The deeper the market lets pullbacks run within an intact trend, the more the momentum is fading — a series of ever-deeper retracements (0.382, then 0.5, then 0.618, then 0.786) is an early warning that the trend is tiring, even before structure breaks.
In a range or chop — the fib's kryptonite
In a sideways, trendless market, fibs are close to worthless and actively dangerous, because there is no trend to continue — "continuation" is a meaningless concept in a range. The pocket becomes just another line price slices through on its way to the other side of the box. In chop, price will tag your pocket, print a reclaim-looking candle, and then reverse right back through it because it was never trending in the first place — it was oscillating. The fix is upstream: confirm the trend before you draw the fib. If the EMAs are tangled and structure is a series of overlapping bars going nowhere, put the fib tool away and trade the range with range tools (the edges of the box, mean reversion to the middle). A perfect golden pocket in a range is a trap that looks like a setup, and it catches more traders than almost anything else.
In high-volatility / news regimes — the fib gets loud and sloppy
On a CPI print, an FOMC decision, an earnings gap, or any event that triples the average candle size, fib levels still matter but they get noisy. Wicks blow clean through the pocket and snap back within a single bar, so a "reject" and a "reclaim" can both appear inside one five-minute candle. Two adjustments keep you sane:
- Widen your read from a line to a zone, and use closes on a higher timeframe. In high vol, judge reclaim/reject on the 15-minute or hourly close, not the 1-minute, because the 1-minute is pure noise around the level.
- Respect that your invalidation needs more room, which means your position size comes down. If the honest stop past 0.786 is now three times its normal distance because volatility tripled, your size must shrink to keep the dollar risk constant. Never widen the stop and keep the size — that's how a normal loss becomes an account event.
The meta-point: the fib is the same, but the regime decides whether it's a scalpel, a blunt instrument, or a trap. Reading the regime before you trust the levels is not optional.

Multi-Timeframe Fibonacci — The Nested Read
A single fib on a single timeframe is a flashlight. Fibs across timeframes are a floodlight, and the discipline of nesting them is where intermediate traders become good ones.
The weighting rule
Higher timeframes dominate. Always. When a daily fib level and a 5-minute fib level disagree, the daily wins — it represents more participants, more capital, and more conviction. HPT weights timeframes explicitly: a daily golden pocket is a heavyweight level; a 5-minute golden pocket is a scalp level. This matters most when they conflict. If your 5-minute chart is screaming "reclaim, go long," but price is sitting under a daily 0.618 that it's rejecting, the daily is telling you the bounce is a lower-timeframe trap inside a higher-timeframe rejection. Trust the daily and either skip the long or treat it as a quick scalp with a tight leash — not a position.
The nested-pocket setup — the highest-conviction fib trade there is
The real prize is alignment: when the higher-timeframe pocket and a lower-timeframe pocket land in the same little zone. Picture this stack:
- The daily impulse leg puts its golden pocket at 20,180–20,210.
- Inside that pullback, price makes a smaller 15-minute impulse leg down, and its golden pocket lands at 20,185–20,195.
Now you have a pocket inside a pocket — two independent fib reads from two timeframes pointing at the same 15-point zone. When price reaches there, you get the daily crowd and the 15-minute crowd defending the same price, and a reclaim off that confluence is about as high-conviction as fib trading gets. You can even use the lower timeframe for a tighter, earlier entry on the higher-timeframe idea: the 15-minute reclaim candle triggers you in with a small 15-minute stop, while your target is the daily extension. That's how you get a huge R multiple — tiny lower-timeframe risk, large higher-timeframe reward.
The practical routine
Draw the fib top-down: daily first (set the bias and the big pocket), then your trading timeframe (15m or 1h — find the tradeable leg), then optionally a 5m for entry precision. Never draw the 5-minute first and then hunt for a daily reason — that's the tail wagging the dog, and it's how you end up long into a daily rejection.
Confluence — Fibs Don't Trade Alone
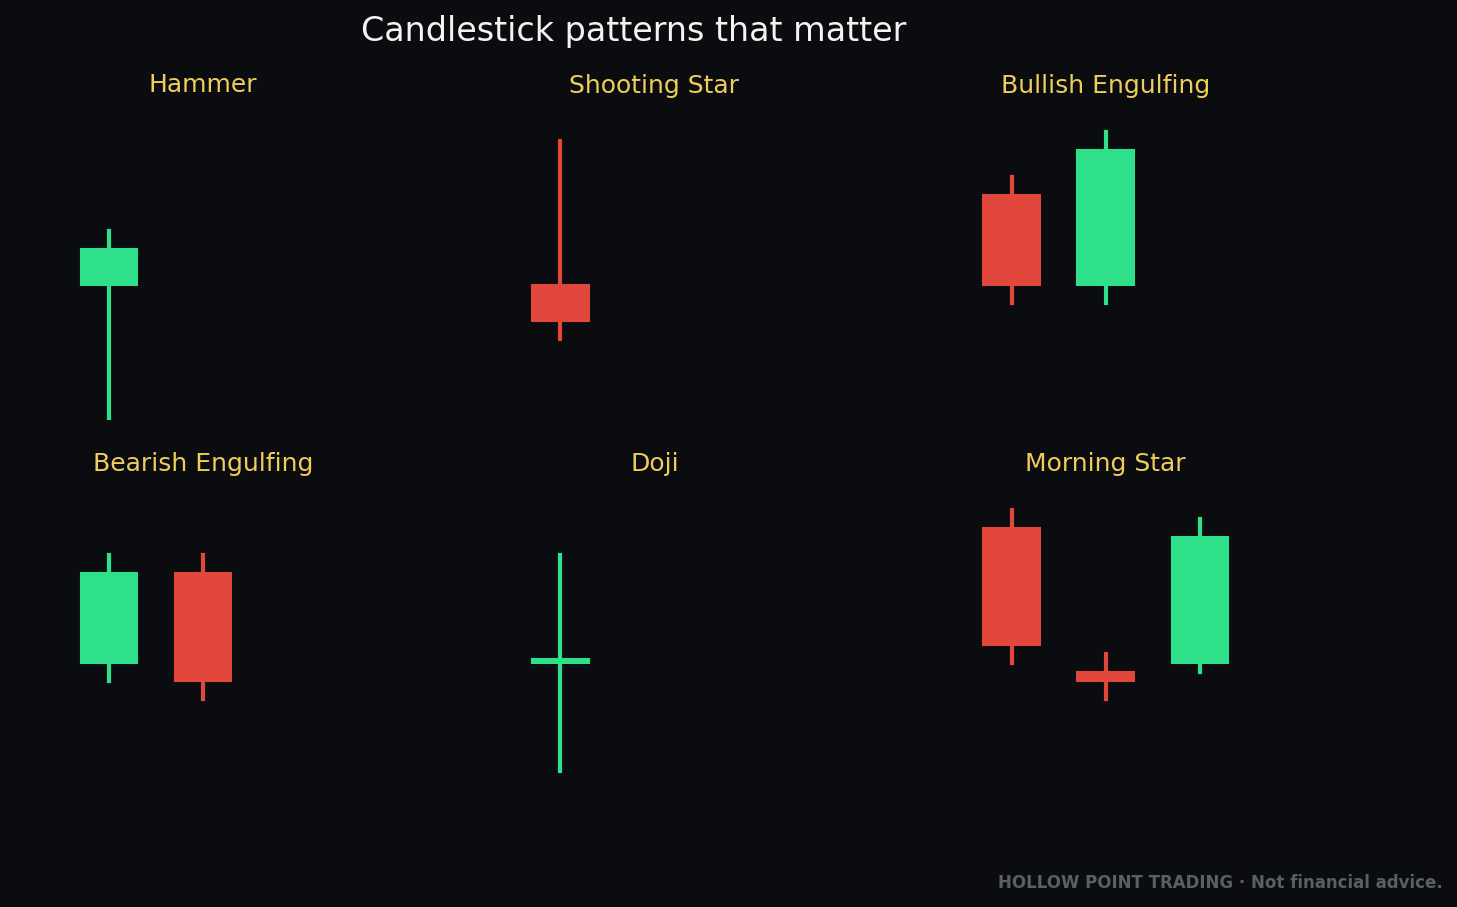
A fib level in isolation is a suggestion. A fib level that overlaps with independent evidence is a setup. This is the beating heart of timeframe-weighted confluence, and it's where fibs stop being a party trick and start being an edge. You want the pocket to land on top of something that is true for reasons that have nothing to do with Fibonacci — because when two unrelated tools point at the same price, the odds that price is meaningful stop being a coincidence.
Fib + EMA — the strongest pairing
When the golden pocket lands right on the 55 EMA — HPT's bias line — you have two entirely different crowds defending the same price for two different reasons: pocket buyers and 55-EMA buyers, stacked. In Worked Example 1, if the daily 55 EMA sat at 20,180, that pocket at 20,175–20,191 just went from "a level" to "the level." The 12 and 22 EMAs do the same job on faster timeframes. A pocket sitting on a rising 55 EMA in an uptrend is one of the cleanest longs on the board, because the trend tool and the pullback tool agree.
Fib + VWAP — the institutional pairing
VWAP (volume-weighted average price) is where the average participant of the session is filled, and institutions defend it because it's their benchmark. Pocket + VWAP + a session low is a triple confluence. Anchored VWAP — dragged from a major swing or a big news bar — lining up with the pocket is heavyweight, because it means the average buyer since that pivotal moment is defending the exact price your fib flagged.
Fib + prior structure — the cleanest confluence there is
If your 0.618 lands on a prior swing high that has flipped to support, or on a prior day's high/low, or on the edge of a volume-profile value area (VAH/VAL) or the POC, the fib is confirming something the raw chart already told you. This is two independent tools pointing at one price, and it's the confluence I trust most because prior structure is pure market memory — it exists whether or not anyone is drawing fibs.
Fib + round number — the psychological pairing
20,000 on NQ, 540 on SPY, a whole-dollar level on a stock, 4.00% on a yield. Round numbers are psychological magnets where orders pile up out of sheer human tidiness. A pocket at 20,191 sitting just under the 20,200 big figure gets extra reaction, because the round-number crowd and the fib crowd are leaning on nearly the same spot.
Fib + candlestick / momentum — the trigger confluence
The confluence tells you where; a reversal candle or a momentum divergence tells you when. A pocket tag that also prints a bullish engulfing or a hammer, while RSI shows a bullish divergence against the swing, is the where and the when arriving together. This is the difference between "price is at a good level" and "price is at a good level and just showed me buyers."
The rule of thumb
One fib level is a maybe; a fib level with two independent confluences is a setup. If the only reason you like a price is "it's the 0.618," you don't have enough — go find the second reason or pass. If the 0.618 is also the 55 EMA and prior structure and it just printed a hammer, you're no longer trading a fib. You're trading a spot where four different kinds of participants are all defending the same price, and the fib was simply the tool that found it first.

Fibonacci Time Zones — Briefly, and Honestly
Everything above measures price. Fibonacci time zones measure time — vertical lines spaced at Fibonacci intervals (1, 2, 3, 5, 8, 13, 21, 34 bars...) from a significant anchor, on the theory that turning points cluster near those lines. In practice this is a secondary, confirming tool, not a primary one, and it's important to be honest about why. It's imprecise — "a reversal somewhere around bar 13" is a wide, forgiving window that will look prophetic in hindsight and vague in real time. And it's trivially curve-fit after the fact, because with lines at 1, 2, 3, 5, 8, 13, 21 you're never far from a line, so some turn will always land "near" one.
Use it, if at all, as a soft heads-up: "we're approaching a fib-time window, so watch for a turn," combined with the price levels that actually carry the trade. Never build an entry on time zones alone, and never let a time zone talk you into or out of a trade that the price levels don't support. Fib time, unlike fib price, is a spice, not the meal — a pinch can add something, but nobody eats a bowl of it.
How the Pros Use Fibonacci Differently From Beginners
Same tool, same ratios, completely different results — and the gap isn't knowledge of the numbers. It's a handful of habits.
Beginners draw many fibs; pros draw one
A beginner covers the chart in retracements from every wiggle, then declares victory when price is "near a fib" — which it always is, because the chart is now plaid. A pro draws one fib from the one leg that matters on the timeframe they're trading, reads it, and deletes it when it's done. Fewer lines, more meaning.
Beginners pick the swing to justify a trade; pros pick the swing first
The beginner has already decided to go long and drags the tool around until a level lands near price. The pro identifies the impulse leg from structure before forming an opinion, then lets the levels tell them what to do — including "nothing." The direction of causation is reversed, and it's the whole difference between analysis and rationalization.
Beginners trade the touch; pros trade the reaction
The beginner buys the instant price kisses 0.618 and gets run over on rejections. The pro waits for the candle to close and show a reclaim or a reject, accepting a slightly worse entry price in exchange for a dramatically better win rate. The touch is where you get ready, not where you get in.
Beginners see a line; pros see a zone and a distribution
A beginner treats 0.618 as an exact price and panics when price overshoots by two ticks. A pro treats the pocket as a zone and understands that a small overshoot into 0.65 or even a wick to 0.70 can be the cleanest fill — it's the stop-run that flushes weak hands right before the reclaim. Pros expect the wick; beginners get shaken out by it.
Beginners need the fib to be right; pros need the fib to be cheap when it's wrong
This is the deepest difference. A beginner is emotionally invested in the level holding and "gives it room" when it fails, turning a defined small loss into an undefined large one. A pro is completely indifferent to whether any single fib works, because their edge is the distribution over many trades with a fixed small risk and a large reward. The pro's relationship to the tool is: it defines where I'm wrong, cheaply, so that when I'm right the reward dwarfs the accumulated small losses. The fib doesn't have to be a crystal ball. It only has to make being wrong inexpensive.
Beginners use fibs alone; pros use fibs as a locator
To a beginner the fib is the signal. To a pro the fib is a locator — it points a spotlight at a price worth investigating, and then EMAs, VWAP, structure, volume, and candles decide whether there's actually a trade there. The pro would happily trade the same spot with no fib on the chart at all, because the confluence is real; the fib just found it fastest.
The Mistakes That Wreck Traders
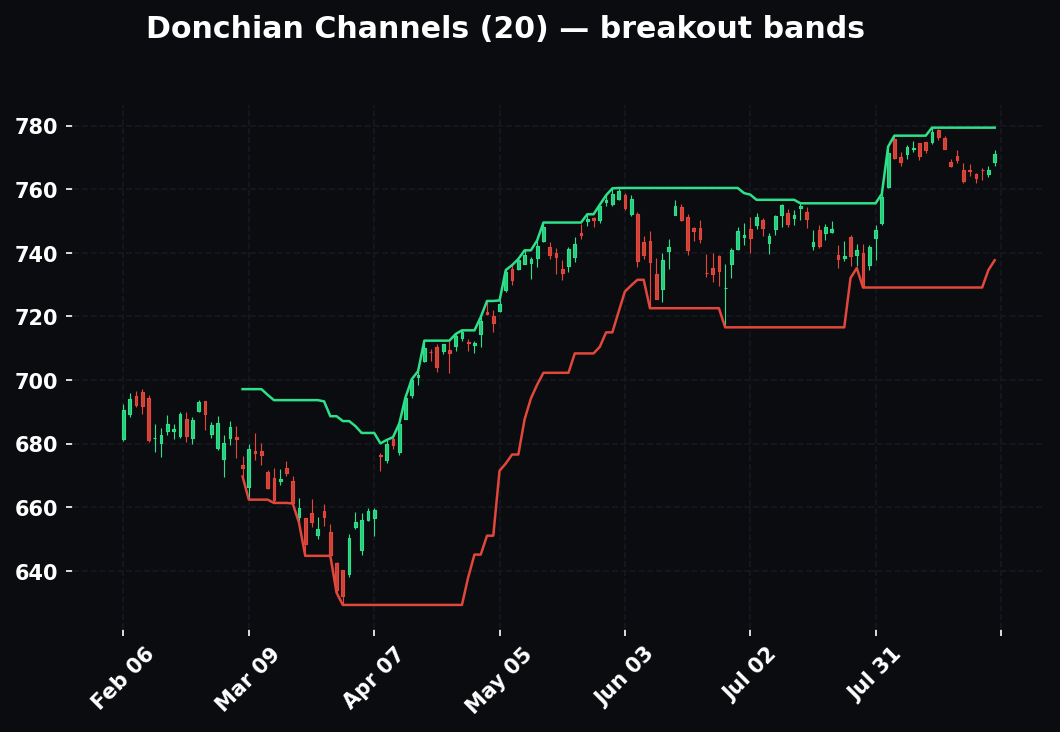
Every failure with this tool traces back to one of these. Learn them cold, because knowing the ratios protects you from none of them.
1. Drawing on the wrong leg. The number-one killer. You fib a messy, choppy swing instead of a clean impulse, and every level it prints is meaningless — yet you trade it with full confidence because "the chart has fibs on it now." Fix: only fib obvious, decisive impulse legs. If you can't instantly point to the swing low and swing high without hovering the cursor, don't draw it.
2. Forcing fibs onto a chart that has no setup. You want to be in a trade, so you drag the tool around until a level lands near current price, then call it "confluence." This is painting the target around the arrow after you've fired. Fix: pick your swing first, from structure, then read what the levels say. Never reverse-engineer the swing to justify a trade you'd already decided to take.
3. Ignoring the regime. A flawless golden pocket in a ranging, trendless market is worthless — there's no trend to continue, so the reclaim read is meaningless and the pocket is just a line price passes through. Fix: confirm the trend (EMA stack + structure) before you trust any retracement. No trend, no fib trade — full stop.
4. Trading the touch instead of the reaction. Price tapping the pocket is not a signal. You have no idea whether it's a reclaim or a reject until a candle closes and shows you. Traders who buy the instant price touches 0.618 get run over every time it's a rejection. Fix: wait for the reaction candle — the wick and, critically, the close — to declare itself.
5. Too many fibs on one chart. Ten retracements from ten different swings turns your screen into a plaid blanket where "price is always near a fib." That is not confluence; it is noise dressed up as evidence. Fix: one or two fibs from the swings that matter on your timeframe. Delete everything else, every session.
6. No invalidation, or a wandering one. The pocket hands you a clean stop — below 0.786, or below 1.0. Traders who enter at the pocket but "give it room" past the full retracement have thrown away the tool's single best feature. Fix: if price closes decisively beyond the level that invalidates your leg, you are wrong. Take the small loss. The 1:3 only exists if the "1" stays small and fixed.
7. Widening the stop when volatility rises but keeping the same size. On a news day the honest stop is farther away, so if you keep your normal size the dollar risk silently triples. Fix: when the invalidation distance grows, the position size shrinks to hold dollar risk constant. Distance and size move in opposite directions, always.
8. Confusing the 0.5 with a Fibonacci ratio and over-trusting it. The 0.5 works because of round-number psychology, not because it's a fib — so in a strong trend that respects true fibs (0.382, 0.618) it can be a weaker level than it looks. Fix: use the 0.5 as a soft midpoint checkpoint, and give more weight to the 0.382 and the pocket when they conflict with it.
9. Anchoring to the extreme wick instead of the meaningful swing. Sometimes the true swing high is the body cluster, and a single spike wick two ticks higher throws every level off. Fix: anchor to the swing that the market actually respected — if a lone wick is distorting your whole grid, anchor to the body/close level the market keeps reacting to and sanity-check that your pocket lands where price is actually turning.
10. Marrying a level after it breaks. Price rejects the pocket, fails, and heads to 0.786 — and you keep "buying the golden pocket" three times on the way down because it "should" hold. Fix: a decisive close through the pocket is new information. Once it's rejected, it's a rejected level, not a discount. Flip your bias or stand aside; don't average into a failed idea.
11. Trading a lower-timeframe fib against a higher-timeframe one. Your 5-minute pocket says long; the daily 0.618 above says the whole bounce is a rejection. Fix: higher timeframe wins. When they conflict, either pass or treat the lower-timeframe trade as a tightly-leashed scalp, never a position.
12. Taking extension targets as entries. Seeing price rip toward the 1.618 and jumping in there, at the exhaustion point, chasing. Fix: extensions are exits. If you missed the pocket entry, you missed the trade — wait for the next setup. Chasing into the target is buying exactly where the pocket-entry crowd is selling to you.
The Playbook — How to Actually Use This Monday
Run this sequence, in this order, every single time. It is deliberately mechanical, because mechanical is what survives a fast market.
- Set the trend. EMA 12/22/55 stack plus structure. Uptrend, downtrend, or no-trade chop. If it's chop — stop here and go do something else.
- Find the last clean impulse leg on your trading timeframe. Obvious swing low, obvious swing high, real move away from both.
- Draw the retracement — low-to-high in an uptrend, high-to-low in a downtrend. One fib. Note the golden pocket band (0.618–0.65).
- Check confluence at the pocket. Is the 55 EMA there? VWAP? Prior structure? A round number? A higher-timeframe pocket? Count your independent reasons. One is weak; two-plus is a setup.
- Plot your extensions — 1.272 and 1.618 beyond the swing. Those are your targets. Confirm the geometry gives you at least 1:3 from a pocket entry to a stop past the 0.786. If it doesn't, the trade isn't worth taking regardless of how pretty it looks.
- Wait for price to reach the pocket. Do absolutely nothing until it does. Most of trading this tool is sitting on your hands, correctly.
- Read the reaction candle. Strong close back out = reclaim = trade the continuation. Weak close through = reject = stand aside or flip your bias toward 0.786/1.0.
- Enter on the reclaim, stop past 0.786, scale out into 1.272 and 1.618. Bank the partials. Move your stop to breakeven after the first target fills.
- If invalidated, take the small loss without argument or negotiation. The level was wrong; the tool did its job by defining "wrong" cheaply and early.
That's the entire discipline. The fib doesn't predict — it pre-marks the decision point and the invalidation — so your only two jobs are patience at the pocket and honesty at the stop. Everything else is the levels doing the work.

Frequently Asked Questions
Which timeframe should I draw fibs on? The one you trade, anchored by the one above it. Day-trading NQ, that's usually a 15-minute or 1-hour leg for the setup, with the daily setting your bias. The ratios are fractal — they work on a 1-minute and a monthly alike — but a daily pocket carries far more weight than a 1-minute pocket, so always know where the higher-timeframe levels sit before you trust a lower one.
Do I include the wicks or use the candle bodies when anchoring? Default to the wicks (the actual swing high and low), because that's what most of the market's tools default to, and coordination is the point. The exception is when a single freak spike wick distorts the whole grid and price is clearly respecting the body/close cluster instead — then anchor to what price is actually reacting to. Consistency matters more than the choice: pick one method and apply it the same way every time.
Is the 0.5 a real Fibonacci level? No, mathematically. It's the plain midpoint. But it's psychologically powerful because humans watch halves, so it stays on the tool and it works — just weight it slightly below the true fibs (0.382, 0.618) when they disagree.
What's the single most important level? The 0.618, the top of the golden pocket. If you learn one price on the entire tool, learn that one and the 0.65 band just beneath it.
How wide should I treat the pocket? As a zone, 0.618 to 0.65, and mentally allow a small overshoot toward 0.70 for a stop-run wick. Judge the reaction on the candle's close, not on where the wick pokes.
Why did my fib "fail"? Almost always one of three things: you drew it on the wrong (non-impulse) leg, the market was ranging so there was no trend to continue, or you traded the touch instead of waiting for the reaction. Fibs rarely fail on their own math — the failure is usually in the setup selection.
Can I use Fibonacci on any market? Yes — futures, stocks, forex, crypto, indices, bonds. It's a behavioral tool measuring trapped participants and crowd coordination, and those exist wherever humans and algos trade. The more liquid and widely-watched the market, the better the levels coordinate.
Do fibs work on longer-term swing and position trades? Absolutely, and arguably better, because higher-timeframe levels attract more capital and more conviction. A weekly golden pocket reclaim is one of the highest-quality signals in swing trading. The mechanics are identical; only the holding period and the stop distance scale up.
Retracement extensions or the three-point trend extension for targets? Start with the simple retracement-tool extensions (1.272, 1.618) — they're fast and good enough for most trades. Graduate to the three-point trend-based extension when you want more precise measured-move targets on high-conviction continuation trades, or as a tiebreaker when the simple targets and the structure disagree.
Should I ever move my stop past the invalidation to "give it room"? No. That is the exact habit that converts the tool's greatest strength — a cheap, defined "wrong" — into an account killer. If price closes decisively past your invalidation, the read is dead. Take the small loss and wait for the next clean leg.
Quick-Reference Cheat-Sheet
The retracement ratios (the pullback):
| Level | Meaning |
|---|---|
| 0.236 | Shallow — very strong / momentum trend |
| 0.382 | First real pullback — strong trends bounce here |
| 0.5 | Midpoint (psychological, not a true fib) |
| 0.618 | Golden ratio — top of the pocket |
| 0.65 | Bottom of the pocket |
| 0.786 | Deep discount — last stand before failure |
| 1.0 | Full retrace — prior swing point / invalidation |
The extension ratios (the targets):
| Level | Use |
|---|---|
| 1.272 | First target — conservative, take a partial |
| 1.618 | Golden extension — most common exhaustion |
| 2.0 | 100% measured move — checkpoint |
| 2.618 | Extended target — strong trends only |
How to draw: trend first → clean impulse leg → low-to-high (up) / high-to-low (down) → one fib, not ten.
The golden pocket: 0.618–0.65. Highest-probability reclaim/reject zone on the chart. Reclaim = strong close back out = continuation entry. Reject = weak close through = failure toward 0.786/1.0. Trade the reaction, never the touch.
Regime check: trend = fib works as written · chop = fib is a trap, stand down · high-vol = widen to a zone, use higher-TF closes, shrink size.
Multi-timeframe rule: higher timeframe wins conflicts. Nested pockets (daily + 15m in one zone) = highest conviction. Draw top-down, never bottom-up.
Confluence stack (want 2+): pocket on the 55 EMA · pocket on VWAP / anchored VWAP · pocket on prior structure or value-area edge · pocket on a round number · pocket on a higher-TF fib · reversal candle + RSI divergence at the tag.
Trade skeleton: enter on the reclaim → stop past 0.786 → targets at prior swing, then 1.272 / 1.618 → scale out, stop to breakeven after T1 → aim for 1:3 minimum.
The cardinal sins: wrong leg · forced fit · ignored regime · trading the touch · too many fibs · no (or wandering) invalidation · widening stop without cutting size · marrying a broken level · lower-TF fib against higher-TF · chasing extensions as entries.
Fibonacci isn't a crystal ball, and it was never meant to be one. It's a ruler for the anatomy of a pullback and a coordination point where the entire market watches the same price at the same time. Draw it on the right leg, respect the regime, wait at the pocket, demand your confluence, and honor the invalidation — and it becomes one of the cleanest edge-defining tools you will ever put on a chart. The tool doesn't have to be right every time. It only has to make being wrong cheap, so that when it's right, the reward buries the small losses. The levels do the work. Discipline banks it.
Bound by rules, feared by trade.
Not financial advice.