
Note: claude-sonnet-5[1m] (the safety classifier) was unavailable (server error) when reviewing this subagent's work. Please carefully verify the subagent's actions and output before acting on them.
Charles Schwab now owns the deepest retail trading platform ever built — here's how to sit down, strap in, and run it like a professional instead of drowning in its switches.
There is a reason that when you ask a room of experienced options traders what they trade on, half of them answer with one word: thinkorswim. It is not the prettiest platform. It is not the easiest to open on day one. But it is the deepest retail trading cockpit ever shipped to ordinary people — a professional-grade risk engine, an options laboratory, a scripting language, a market scanner, and a paper-trading simulator, all bundled free with a brokerage account.
thinkorswim was built by thinkorswim, Inc., bought by TD Ameritrade, and — after Schwab acquired TD Ameritrade — migrated wholesale to Charles Schwab. That migration finished in 2024. TD Ameritrade's own websites and apps are retired. If thinkorswim was the reason you loved TDA, you did not lose it; you now reach it through a Schwab account. This guide teaches you the whole machine top-down, the Hollow Point way: what it is, how to get in, and how to actually use the parts that make it worth living inside — with worked examples, regime-by-regime behavior, the confluence stack that ties the tools together, and the mistakes that quietly bleed accounts dry.
One promise up front, and it's a hard rule at Hollow Point Trading: every fee, level, and menu path below was verified against Schwab's own documentation as of writing. But trading platforms rewrite their screens constantly. Where I name a button or a tab, treat it as where the function lives, not a pixel-perfect map. When your screen disagrees with mine, your screen is right — verify the current UI and move on. That habit — trust the live screen over any guide, mine included — is itself a professional discipline. Beginners memorize pixels. Professionals memorize functions and find them wherever the platform has moved them this quarter.
What It Is & Who It's Best For
thinkorswim (lowercase, always — the brand is stylized that way) is Schwab's flagship active-trader platform. It comes in three flavors that share one login and one account: a downloadable desktop application, a browser-based web version, and a mobile app. All three are free. There is no subscription, no platform fee, and no minimum balance to use them.
The core audience: options traders
The platform is a genuine standout for one audience above all others: options traders. Nowhere else in the retail world do you get the Analyze tab's risk-profile visualizer, live probability math on every strike, a backtesting engine (thinkBack), a historical replay simulator (OnDemand), a full-featured paper-trading account (paperMoney), and a scripting language (thinkScript) — all bundled at zero cost. Stock traders, futures traders, and forex traders are well served too. But the platform leans toward the derivatives crowd, and it rewards people willing to climb its learning curve.
Think about what an options position actually is: a bet that has three separate dimensions moving at once — where the stock goes, how much time is left, and how frightened the market is. A stock trade has one dimension. An options trade has three, and they interact in ways that are genuinely hard to hold in your head. thinkorswim exists to draw those three dimensions on a screen so you can see the position instead of imagining it. That is the whole reason it earns its complexity.
Who it's for and who it isn't
Who it's best for: the trader who wants to understand a position before entering — how it behaves as price moves, as time decays, as volatility shifts. Who it's not ideal for: someone who wants a three-tap "buy Apple" app and nothing more. Schwab has simpler tools for that (the Schwab.com website and the Schwab Mobile app both do plain investing cleanly). thinkorswim is a cockpit, and cockpits have a lot of switches.
A useful gut check: if you can name the strategy you want to run and you care what its maximum loss is, you belong on thinkorswim. If you cannot yet name a strategy and you just want to "buy some Tesla," start simpler and graduate here when your questions get harder. The platform is overkill for a buy-and-hold investor and exactly right for a working options trader.
Opening & Funding a Schwab Account
thinkorswim rides on top of a Charles Schwab brokerage account. You open the account, then you turn on the platform. Here's the workflow, step by step, with the parts that actually trip people up called out.
Step 1 — Start the application. Go to Schwab.com and choose to open an individual brokerage account (the standard taxable account is the right starting point for most active traders; more on account types below). You'll need the usual: Social Security number, employer info, date of birth, and answers to a batch of financial-suitability questions.
Step 2 — Answer the trading-experience questions honestly. This part matters more than beginners realize. Schwab uses your stated income, net worth, investment objectives, and years of trading experience to decide what you're approved to do — especially with options and margin. Sandbagging the answers to "look conservative" can lock you out of strategies you want; inflating them to unlock levels you don't understand is how people blow up. Tell the truth. Your future options approval hinges on it, and — this is the part beginners miss — there is no upside to lying in either direction. Under-report and you get denied the tools you want. Over-report and you get handed a loaded weapon with no safety. The honest answer is also the optimal one.
Step 3 — Fund the account. There is no minimum deposit to open a Schwab account or to use thinkorswim. You can link a bank via ACH, wire funds, transfer an account in (ACAT), or mail a check. ACH is free and simplest; it typically takes a couple of business days for funds to clear before you can trade with them. Wires are same-day but usually carry a fee from the sending bank. An ACAT transfer (moving an existing brokerage account over in kind) can take a week or more and is worth doing if you already hold positions elsewhere — but don't wait on it to start learning; open, drop in a small ACH deposit, and get into paperMoney while the rest settles.
Step 4 — Enable thinkorswim. Once your account is open and funded, request access to thinkorswim (in some paths it's on by default; in others you enable it from your account's trading settings). Download the desktop app from Schwab's thinkorswim page, or open the web version in a browser, or grab the mobile app from your phone's store. Log in with your Schwab credentials — the same login works across all three surfaces and across paperMoney.
Step 5 — Turn on paperMoney first. Before you risk a dollar, flip the platform into its simulated-trading mode (covered in its own section). This is the single highest-value habit a new thinkorswim user can build, and it costs nothing but the humility to practice before you perform.
A note on timing
Realistically, budget a week from "I decided to do this" to "I placed my first considered live trade." Roughly: a day for the application and identity checks, two-plus business days for ACH funds to clear, and then — this is the part you shouldn't rush — as many days in paperMoney as it takes to run your intended strategy cleanly a couple of dozen times. The traders who blow up in month one are almost always the ones who compressed that week into an afternoon.
The Interface: Desktop vs Web vs Mobile
The three versions are not three tiers of the same thing so much as three tools for three situations. Understand the split and you'll stop fighting the platform.
Desktop — the real machine
Desktop is where the power lives. It's a downloadable application (Windows and Mac) and it hosts everything: custom indicators, thinkScript studies, backtesting, OnDemand replay, multi-monitor layouts, the full Analyze tab, options statistics, and deep chart customization. If you are serious about options or active trading, the desktop app is your home base. Everything in this guide assumes desktop unless noted.
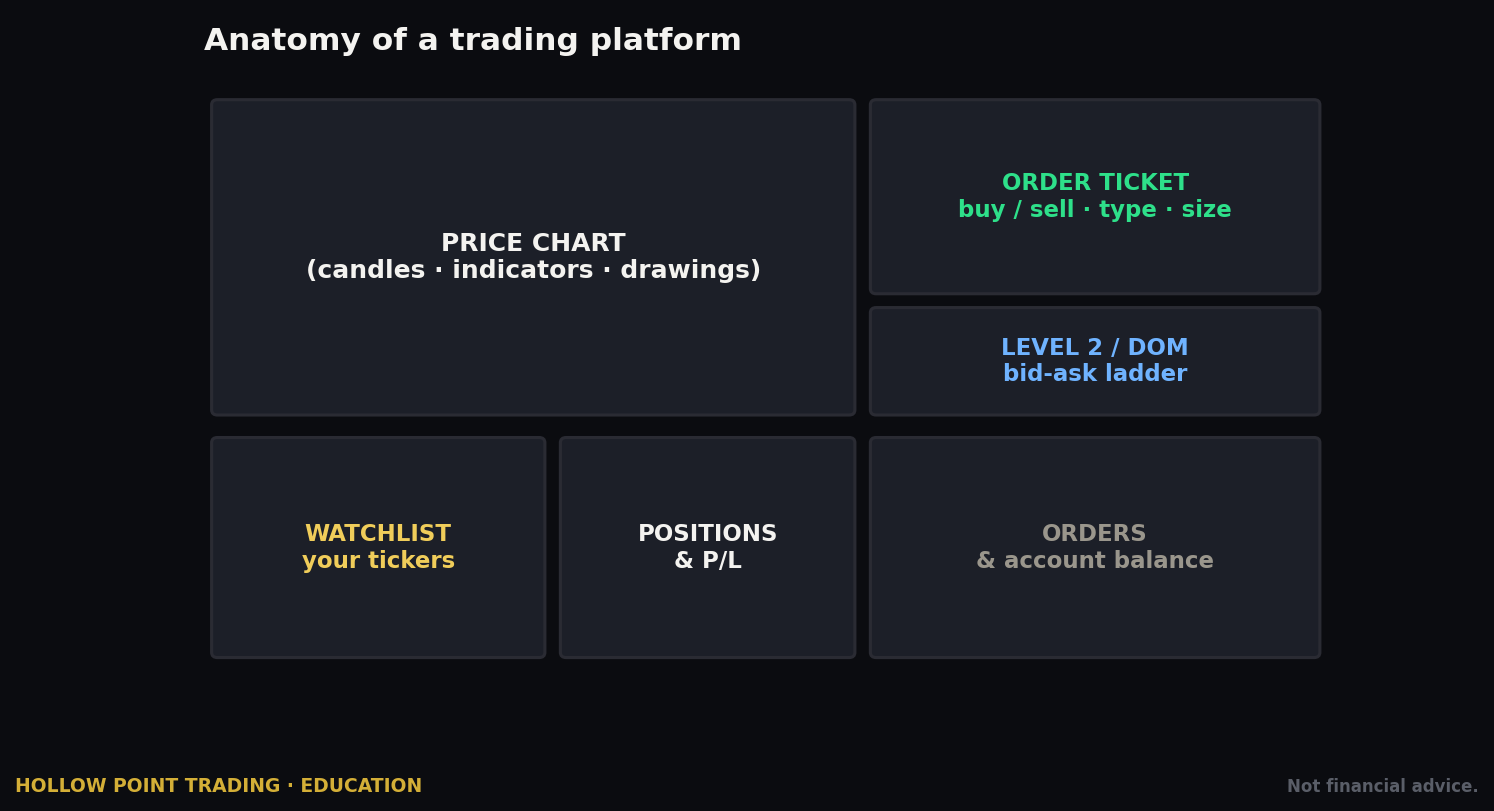
The desktop layout is organized as tabs across the top: Monitor (your positions, orders, and account balances), Trade (order entry and the option chain), Analyze (the risk lab), Scan (stock and options screeners), MarketWatch (quotes, alerts, calendars), Charts, Tools, Education, and a Help center. Down the left sidebar live the "gadgets" — small always-on panels for your account balance, active trades, a mini-chart, Level II, and more. You build the workspace you want and save it. Desktop also supports detaching any tab into its own window, which is how multi-monitor traders spread a chart across one screen and the chain plus Monitor across another.
Web — the clean traveling version
Web (thinkorswim web) runs in a browser with nothing to install. It's a streamlined, cleaner-looking subset: solid charts, an option chain, order entry, and basic monitoring. What it lacks is the deep stuff — full thinkScript customization, backtesting, the complete Analyze suite, and the heavier tools. It's genuinely good for placing a trade or checking a position from a machine that isn't yours (a work computer where you can't install software, a borrowed laptop). It is not where you'd do your homework.
Mobile — the pocket monitor
Mobile (thinkorswim mobile) is the most streamlined of all — a condensed, touch-first version for managing trades on the go. You can chart, read a chain, place and manage orders, set alerts, and check balances. You cannot rebuild your desktop workspace on a phone screen, and you shouldn't try. Treat mobile as your monitoring and management tool, not your analysis desk. Its highest-value features are push alerts (so a level you're watching pings your pocket) and the ability to flatten a position fast when you're away from your desk.
The HPT read: do your analysis on desktop, place considered orders on desktop, and use web and mobile to watch and adjust. Don't make entry decisions on the smallest screen you own. The phone is where discipline goes to die — the friction that stops you from doing something dumb (opening the Analyze tab, checking the risk profile, matching the TIF on a bracket) is exactly the friction a phone strips away.
The Chart Engine & Studies
thinkorswim's charts are professional-grade and endlessly configurable. Right-click any chart to reach its settings; from there you control chart type (candles, Heikin-Ashi, bars, line, and specialty types), time aggregation, and the whole studies library.
Studies are indicators
Studies are indicators. thinkorswim ships hundreds — every moving average, RSI, MACD, Bollinger Bands, VWAP, volume profile, and dozens you'll never touch. You add them from the Studies menu (the beaker/flask icon on the chart toolbar). The thing that sets this engine apart is that studies aren't a fixed list — with thinkScript (its own section below) you can write your own and drop them on the chart like any built-in.
The HPT trend stack
For HPT students, the chart is where our framework lives. Set your EMAs to 12, 22, and 55 — that's the Hollow Point trend stack, not the generic 9/21. Here's how to read it:
- Stacked and rising, price above all three (12 over 22 over 55): clean uptrend. You're looking for longs on pullbacks to the 12 or 22.
- Stacked and falling, price below all three (12 under 22 under 55): clean downtrend. You're looking for shorts on bounces into the 12 or 22.
- Tangled — the three EMAs braided together and flat: no trend. This is chop, and it is where trend-following setups go to die. Stand aside or switch to range tactics.
- Price rejecting the daily 55 from below: that's your bias tell. On the daily chart the 55 EMA is the line that separates "buyers in control" from "sellers in control" for the swing timeframe. Watch how price behaves the first time it tags the 55 after a move — acceptance through it or rejection off it sets the tone for days.
thinkorswim lets you save that exact study set as a template so every chart you open wears it automatically. Build the template once; never rebuild the read. Go to the Studies menu, add your three EMAs with lengths 12, 22, and 55, color them so the 55 stands out, then save the whole configuration as a named template. From then on, applying "HPT stack" to any symbol is one click.
OnDemand — the time machine
One more chart-adjacent power tool: OnDemand. It replays historical market data as if it were live, letting you paper-trade a past day tick by tick. For learning how a setup actually unfolds — not how it looks in hindsight — nothing beats it. The value here is subtle but enormous: a chart in hindsight shows you the answer. OnDemand hides the right edge and makes you decide before the next bar prints, which is the only way to practice the actual skill of trading. Pick a volatile day from last month, jump OnDemand to that morning, and trade the open as if it were live. You'll learn more about your own hesitation and impulse in an hour of this than in a week of reading charts after the fact.
Multi-Timeframe: Reading the Ladder
A single chart is a single opinion. The professional read stacks timeframes so a trade only fires when several of them agree — this is the core of the Hollow Point method, and thinkorswim is built to support it.
The top-down pass
Start high and work down. On the daily, establish bias from the 55 EMA and the major structure (higher highs and higher lows, or lower highs and lower lows). On the hourly or 2-hour, find the intermediate trend and the levels that matter for the next few days. On the 15-minute or 5-minute, time the actual entry. The rule: the small timeframe never overrides the large one for direction — it only sharpens the entry within the direction the large timeframe already gave you.
Worked example. Say NQ (or your stock) is above a rising daily 55 EMA — daily bias is long. The hourly pulls back into its own 22 EMA and holds. You drop to the 5-minute and wait for a reversal candle — a hammer, an engulfing bar, a failed breakdown — right at that hourly 22 level. Now three timeframes agree: daily trend up, hourly at support, 5-minute reversal confirming. That is a confluence entry. Compare it to a lone 5-minute buy signal with a falling daily 55 overhead — same 5-minute candle, completely different trade, because the higher timeframe disagrees.
Building it in thinkorswim
You can lay four charts in a grid (the Charts tab supports 1x1 up to large grids) and set each to a different aggregation, all following the symbol you type. Some traders instead use a single chart with a multi-timeframe study that plots the higher-timeframe EMA on the lower-timeframe chart — thinkScript's close(period = AggregationPeriod.DAY) construct pulls a daily value onto a 5-minute chart so you can see the daily 55 as a line without switching windows. Either approach works; the grid is more honest for beginners because it forces you to actually look at each timeframe rather than trusting one plotted line.
The Trade Tab & the Option Chain
The Trade tab is where you buy and sell. Type a symbol into the box and you get the current quote plus, front and center, the option chain.
Anatomy of a chain
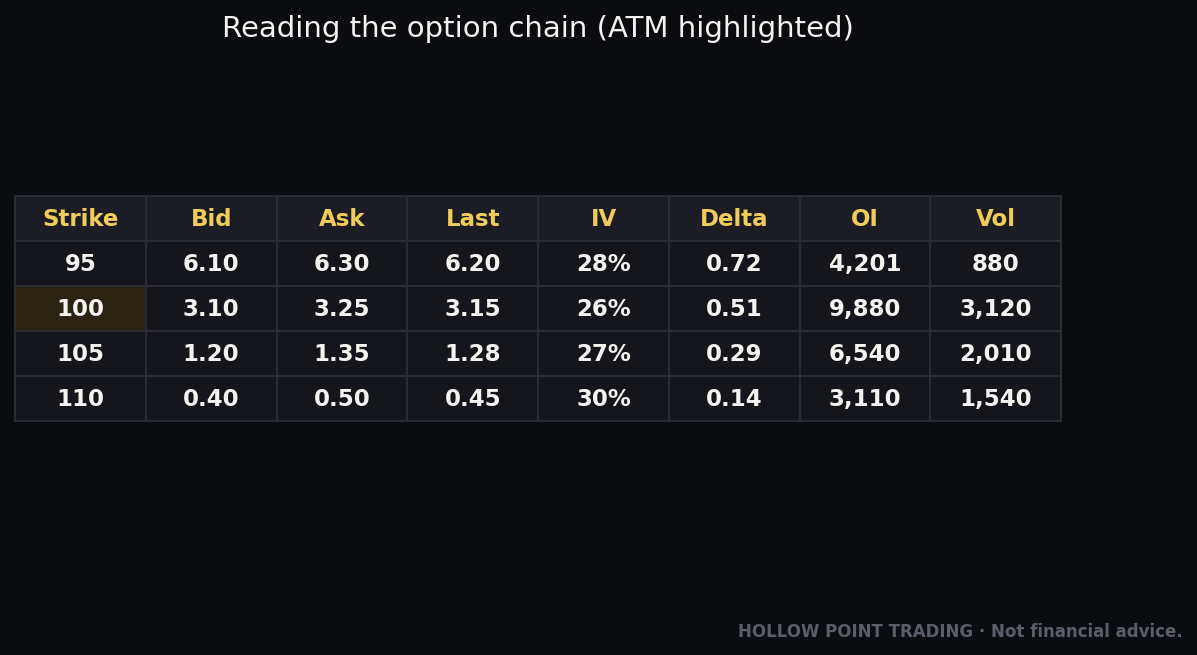
Reading an option chain is a core skill, so let's define the anatomy once. The chain is a table split down the middle by strike price (the price at which the option lets you buy or sell the stock). Calls are on one side, puts on the other. Each row is one strike; each strike has a bid (what buyers will pay), an ask (what sellers want), volume and open interest (how much is trading today, and how many contracts exist in total), and — this is where thinkorswim shines — the Greeks: delta, gamma, theta, and vega, the numbers that describe how the option's price reacts to movement, time, and volatility.
Read those Greeks in plain English:
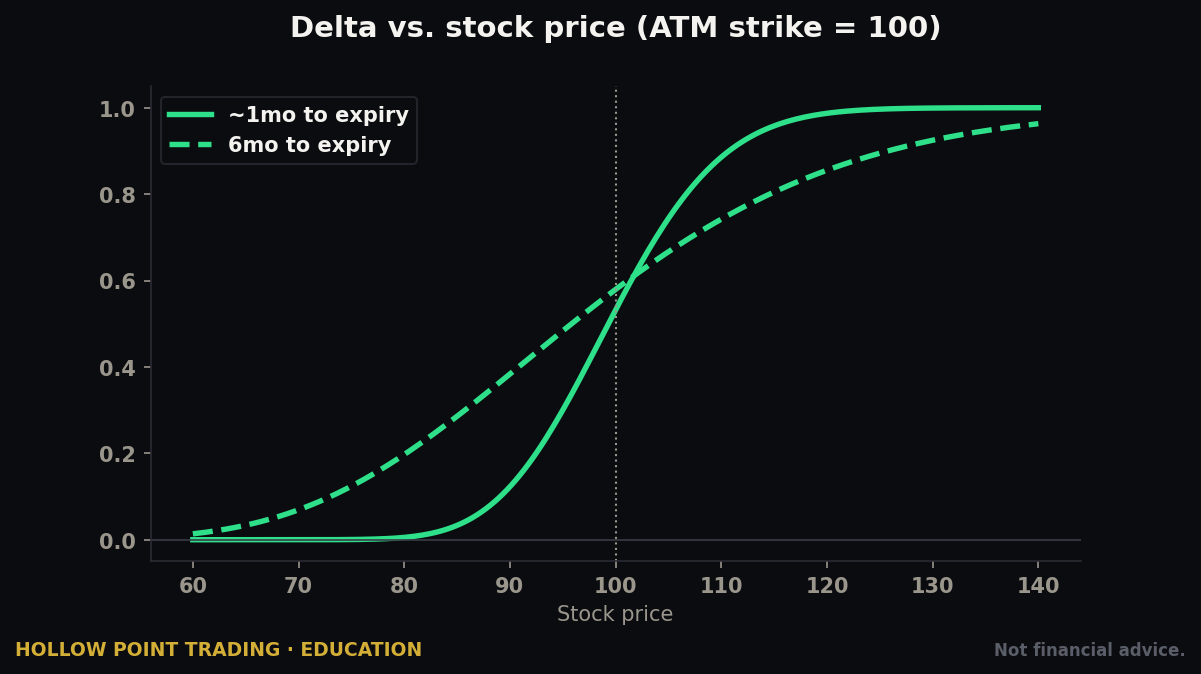
- Delta — how much the option moves per $1 move in the stock, and a rough proxy for the probability of finishing in-the-money. A 0.30 delta call gains about $0.30 per $1 up-move and has loosely a 30% chance of expiring in-the-money.
- Gamma — how fast delta itself changes. High gamma (near-the-money, near expiration) means your delta swings fast; the position gets twitchy.
- Theta — daily time decay. A theta of -0.08 means the option loses about $8 per contract per day, all else equal. Theta is the rent a long option holder pays.
- Vega — sensitivity to implied volatility. A vega of 0.12 means a 1-point rise in IV adds about $12 per contract. This is why options bought before an earnings spike can lose money even when the stock moves your way — IV collapses after the event and vega works against you.
Customizing the chain
thinkorswim lets you customize exactly which columns show. You can add probability of the option expiring in-the-money (Prob ITM), implied volatility per strike, open interest, and more, right in the chain. You choose the expiration date from a dropdown, and you can view the chain as single options or as pre-built spreads (verticals, iron condors, butterflies, calendars — pick the strategy from a menu and the platform lays out the legs for you). This is a genuine differentiator: instead of manually assembling a four-legged iron condor and hoping you got the legs right, you tell the chain "iron condor" and it builds the ticket with the correct buys and sells.
To trade, you click a bid or ask. That populates an order ticket at the bottom of the screen, pre-filled with the strike, side, and price. Nothing sends until you confirm — which brings us to the ticket itself.
Getting Options Approval & the Approval Levels
You cannot trade options until Schwab approves you for options, and what you can trade depends on your approval level. Current Schwab clients apply online: log in, find the options-application flow in your account's trading settings, and submit. Schwab reviews your experience, objectives, and financials — the honest answers from account opening — and assigns a level.
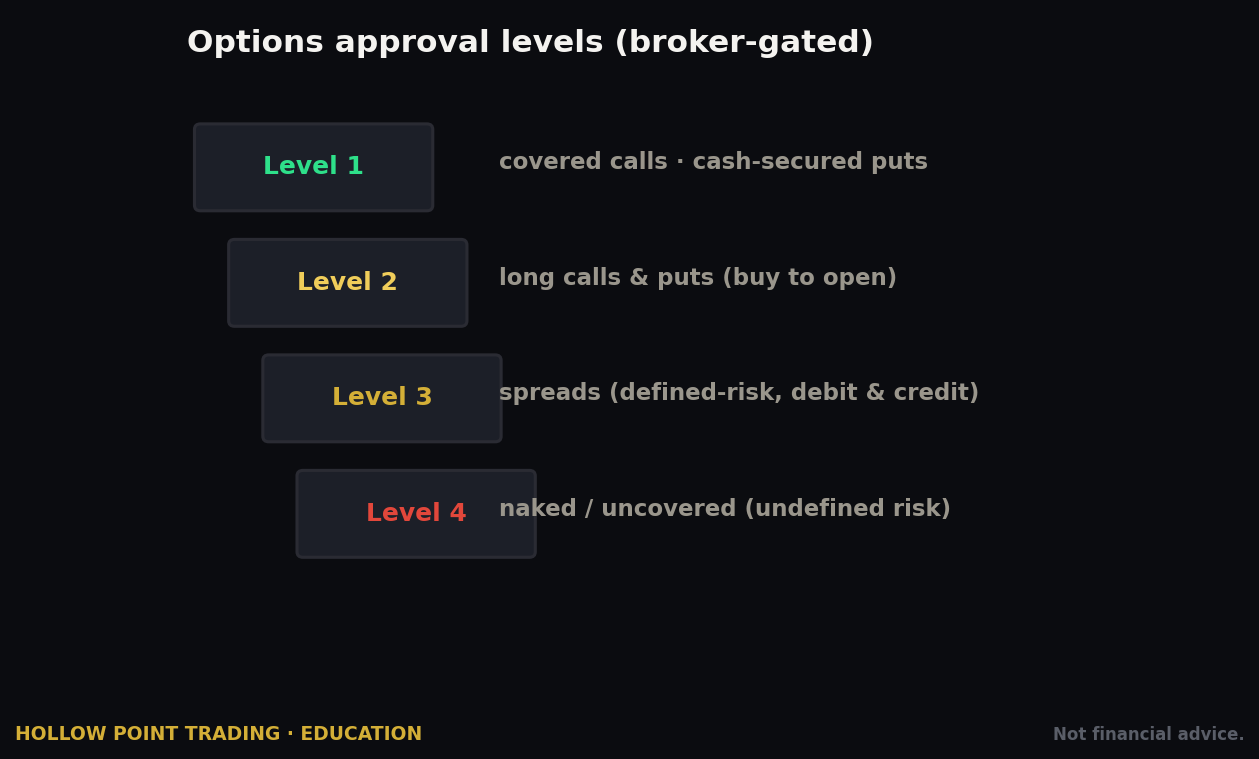
Schwab uses Options Levels 0 through 3 (note: this differs from brokers who number them 1–4). Verify current definitions on your application screen, but as documented they run:
- Level 0 — Covered calls. The most basic. You can sell call options against stock you already own, and do cash-secured equivalents. Defined, conservative risk — the worst case is that your stock gets called away at a price you already agreed to.
- Level 1 — Long calls and long puts. You can buy calls (betting up) and buy puts (betting down). Your risk is capped at the premium you pay. This is where most directional options trading begins, and honestly where a huge share of good trading stays.
- Level 2 — Spreads. Multi-leg defined-risk strategies — vertical spreads, iron condors, calendars, and the like, where you buy one option and sell another to cap both risk and reward. Level 2 is the ceiling for IRA accounts at Schwab, and it typically requires around two-plus years of stated options experience.
- Level 3 — Uncovered (naked) and advanced. The strategies with undefined or margin-intensive risk, such as selling uncovered options where a single bad move can cost multiples of the premium collected. Requires margin and the highest approval bar.
The HPT stance: don't chase the highest level you can get approved for. Get the level that matches strategies you actually understand and can size at 1:3 reward-to-risk. Level 1 and Level 2 cover an enormous amount of disciplined, defined-risk trading — long calls and puts, and every flavor of vertical and condor. Naked selling is a different animal entirely: your max loss is large and your max gain is small, and the strategy only works with iron risk management and real capital behind it. Approach Level 3 only when you truly understand assignment risk and can stomach the tail. A trader who runs Level 1 and 2 with discipline will out-earn a trader who runs Level 3 with hope.
The Order Ticket & Every Order Type
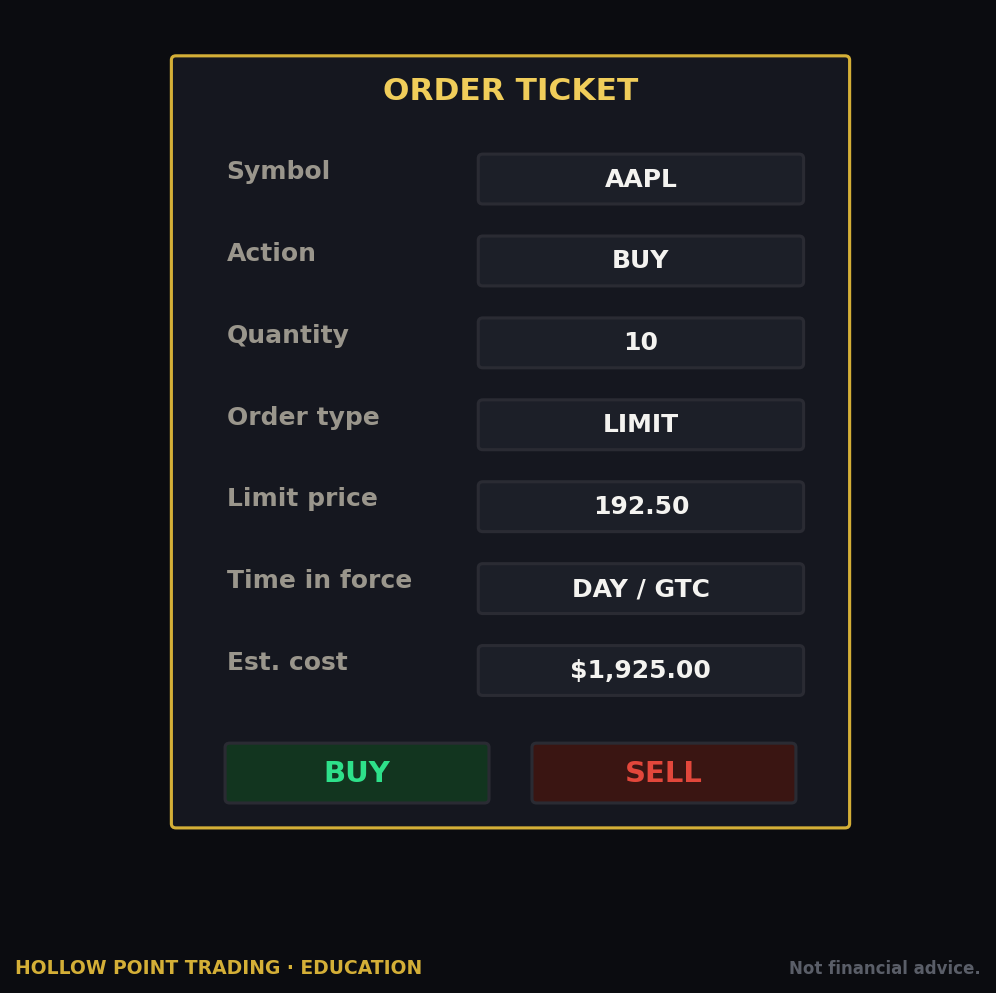
The order ticket is the heart of execution, and thinkorswim's is deep. Every ticket has the same core fields: symbol, side (buy/sell, or the specific options action — buy to open, sell to close, and so on), quantity, order type, price, and time-in-force.
The four options actions confuse beginners, so pin them down: buy to open starts a long position, sell to close exits it; sell to open starts a short position, buy to close exits it. Choose the wrong one and you can accidentally double your position instead of closing it.
The order types you'll use
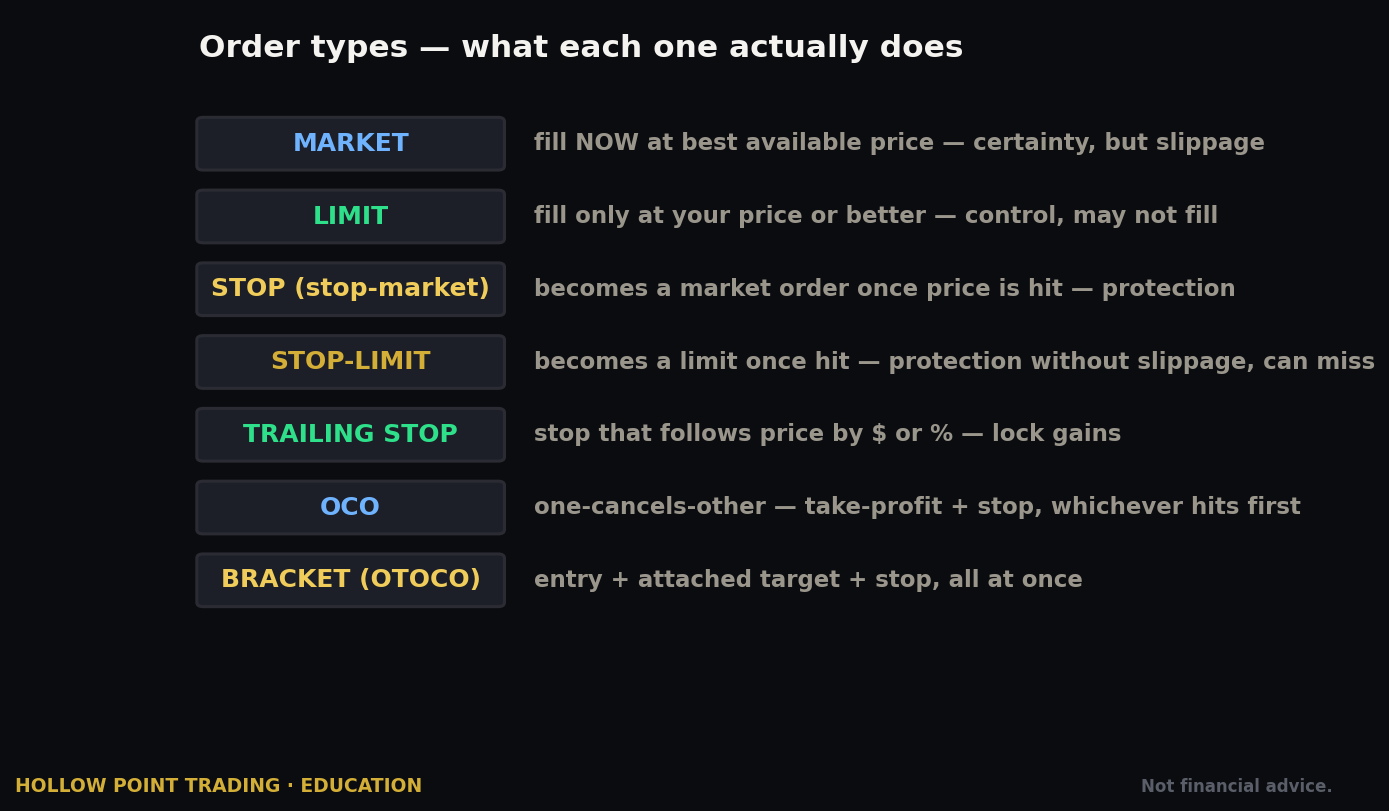
- Market — fills immediately at the best available price. Fast, but you don't control the price. Genuinely dangerous in thin or fast markets, and especially on options.
- Limit — fills only at your price or better. You control price, not speed. The default choice for options, where spreads can be wide.
- Stop (stop-market) — a resting order that becomes a market order once price touches your stop level. Your discipline tool for cutting losses.
- Stop-limit — becomes a limit order at your stop, protecting you from a terrible fill but risking no fill at all in a gap. Use with care: in a fast breakdown a stop-limit can leave you stuck in a losing position because price blew past your limit.
- Trailing stop — a stop that follows price by a set amount or percentage, locking in gains as a position runs. Set it too tight and normal noise stops you out; set it too loose and you give back most of the move.
- Market-on-close / limit-on-close — execute at or near the closing print, useful for strategies that must be flat or positioned at the bell.
Time-in-force
Time-in-force (TIF) controls how long an order lives: Day (dies at the close), GTC (good-till-canceled, up to a set horizon — commonly 60 days at Schwab, then it expires), plus extended-hours variants (GTC+EXT lets a resting order work before and after the regular session). On thinkorswim the TIF menu sits to the right of the order type — remember its location, because it matters enormously for the conditional orders below. A mismatched TIF is the single most common reason a bracket misbehaves.
Pricing a limit intelligently
Since limit is your default on options, learn to price it. The mid (halfway between bid and ask) is your reference. On a liquid option with a penny-wide spread, just take the ask to get filled — the spread costs you nothing. On a wide spread — say bid 1.20, ask 1.60 — starting at the mid (1.40) and waiting is smart; if you need the fill, walk the price up a nickel at a time rather than crossing straight to 1.60 and donating 40 cents to the market maker. thinkorswim shows the mark (usually the mid) right on the chain, so you always know where fair value sits.
Complex Orders: OCO and First-Triggers-OCO
This is where thinkorswim separates from beginner platforms, and where HPT discipline gets automated. Two constructs to know cold.
OCO — One-Cancels-Other
Two orders linked so that if one fills, the other is automatically canceled. The classic use: you're in a long position and you want both a profit target and a stop loss resting in the market. You place a sell-limit above (the target) and a sell-stop below (the stop) as an OCO. Whichever hits first executes; the other vanishes so you don't accidentally sell twice.
Worked example. You're long 100 shares at $40. Target 30% higher at $52 as a sell-limit; stop 10% lower at $36 as a sell-stop; bind them as an OCO. Price runs to $52, your limit fills, you book the gain, and the $36 stop cancels itself automatically. Or price fades to $36, the stop fires and flattens you, and the $52 target evaporates. Either way you never end up double-sold, and both exits were decided before emotion entered the picture.
First-Triggers-OCO — the bracket
This nests the OCO behind an entry. You place one order to get in — and the moment it fills, it automatically launches an OCO pair (target + stop) around the new position. This is the entire HPT trade plan encoded as a single ticket: entry, target, and stop, defined before you're even filled. Set your 1:3 reward-to-risk in the order itself, and the market executes your discipline for you whether you're watching or not.
Worked example with the 1:3 math. You want to buy a call at $2.00. Your plan: risk $0.50 to make $1.50 — a clean 1:3. Build a first-triggers-OCO: the entry is a buy-to-open limit at $2.00; the moment it fills, it launches an OCO of a sell-to-close limit at $3.50 (the +$1.50 target) and a sell-to-close stop at $1.50 (the −$0.50 stop). You've now defined the whole trade before you're in it. If the option runs to $3.50 you're out with a triple on risk; if it sags to $1.50 you're out for the planned loss. You never had to make a decision under fire, which is the entire point — the decisions you make calm are better than the ones you make while the position moves.
The TIF trap
A critical practical note verified from Schwab's own docs: when you build these conditional orders, the time-in-force on every leg should match. Mismatched TIFs are the most common reason a bracket behaves in ways beginners don't expect — a stop that expires overnight while the target keeps working, leaving you unprotected the next morning. Set them all to Day, or all to GTC — not a mix. thinkorswim can also trigger these off conditions (an options order that fires when the underlying stock crosses a level — for instance, buy the call only if the stock trades above yesterday's high), which is genuinely powerful and genuinely easy to misconfigure. Build them in paperMoney until they're second nature, then check the working-orders view after every live entry to confirm both protective legs actually landed.
The Analyze Tab: Risk Profile & Probability
If the option chain is why traders come to thinkorswim, the Analyze tab is why they stay. This is the risk laboratory, and it has no free equivalent anywhere in retail.
The Risk Profile
The centerpiece is the Risk Profile. Load a trade — real or simulated — and Analyze draws a profit-and-loss diagram: a curve showing exactly how much you make or lose at every possible price of the underlying. You see your maximum gain, maximum loss, and breakeven points at a glance, before you risk a cent. For an options position, this is the difference between knowing what you own and hoping you understand it.
The tool visualizes how that P&L curve shifts with three forces: price (the stock moves left or right along the horizontal axis), time (theta decay as expiration approaches — watch the curve sag toward the loss zone as the days tick off), and implied volatility (vega — what happens if fear rises or falls). Slide any of them and watch the curve breathe.
A worked read of a vertical spread
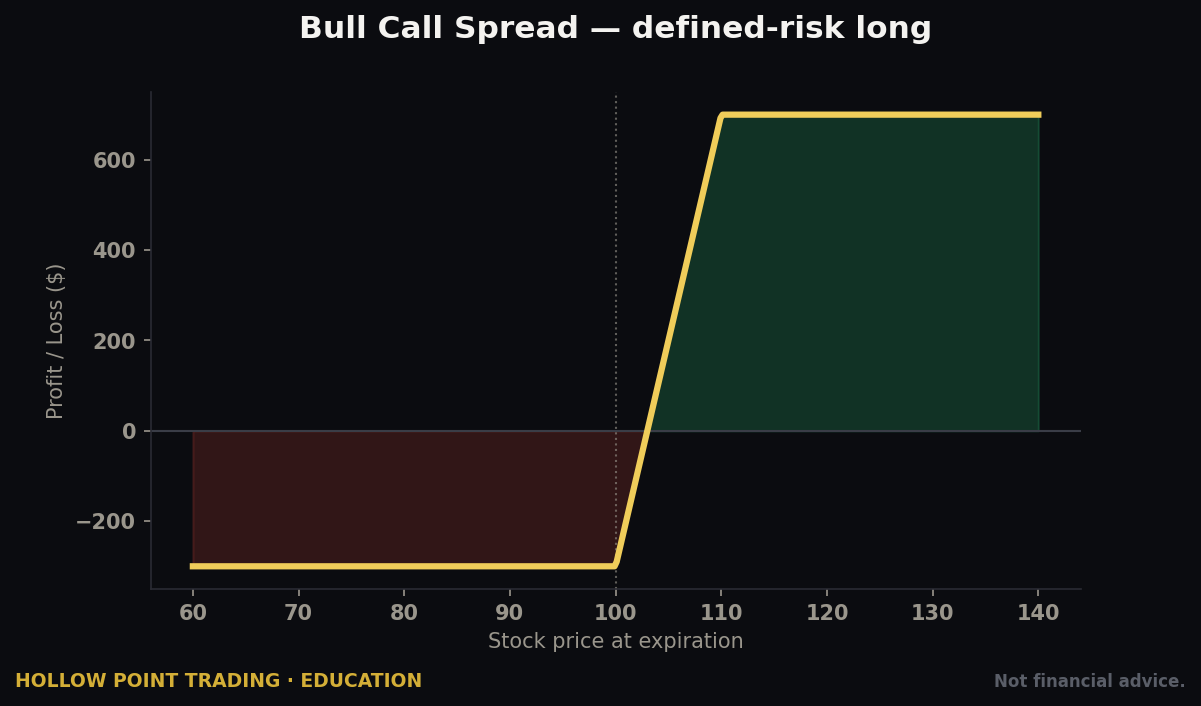
Say you build a bull call spread: buy the $100 call, sell the $105 call, same expiration, for a net debit of $2.00 (that's $200 per spread). Drop it into the Risk Profile and it tells you three things instantly. Max loss: the $2.00 you paid, if the stock finishes below $100 — the curve flatlines at −$200. Max gain: the $5 spread width minus the $2 you paid = $3.00, or $300, if the stock finishes above $105 — the curve flatlines at +$300. Breakeven: $102, the lower strike plus the debit. Now you can see that this is a roughly 1:1.5 risk/reward structure, and you can slide the time slider to watch how much of your gain evaporates if the stock only grinds to $103 with two weeks left versus at expiration. That single picture replaces a page of mental arithmetic — and it's honest arithmetic, because the platform computes it from live prices and IV, not from a napkin.
Probability analysis
Alongside it sits probability analysis — the platform's estimate of the odds that price ends up above, below, or between chosen levels by expiration, derived from current implied volatility. Read this the way HPT reads everything: as edge, not prophecy. Schwab states it plainly, and so do we — these probabilities are theoretical, not guaranteed, and reflect no certainty about any outcome. They're a tool for sizing conviction, not a crystal ball. A 70% probability-of-profit trade still loses three times out of ten, and those three can cluster. Probability tells you whether the odds justify the bet; it never tells you what happens next.
The Analyze tab also includes simulated trades (drop a hypothetical position onto an existing one and see the combined risk profile — invaluable for checking what an adjustment does to your total risk before you make it) and thinkBack, a backtesting tool for testing options ideas against historical option prices. Together these turn "I think this trade is good" into "here is exactly what this trade risks, at these prices, over this time, under these volatility assumptions."
The Confluence Stack: Combining the Tools
No single tool on thinkorswim is a trade signal by itself. The edge comes from stacking them so several independent reads point the same way. Here's how the pieces combine.
EMA stack + volume profile + probability
Layer three things. First, the EMA 12/22/55 stack gives you trend and a level — say the daily is stacked up and price is pulling back into a rising 22 EMA at $98. Second, add a volume profile study; if the high-volume node (the price where the most volume has traded, the market's fair-value shelf) also sits near $98, you now have a structural reason the level should hold — real buyers did business there. Third, open the option chain's probability column: if the 95-strike put you'd sell (or the 100-strike call you'd buy) shows odds that fit your plan, the options math agrees with the chart. Three independent lenses — trend, volume structure, options probability — all pointing at the same $98 shelf. That is a confluence entry, and it's far stronger than any one of the three alone.
Level II + the chart level
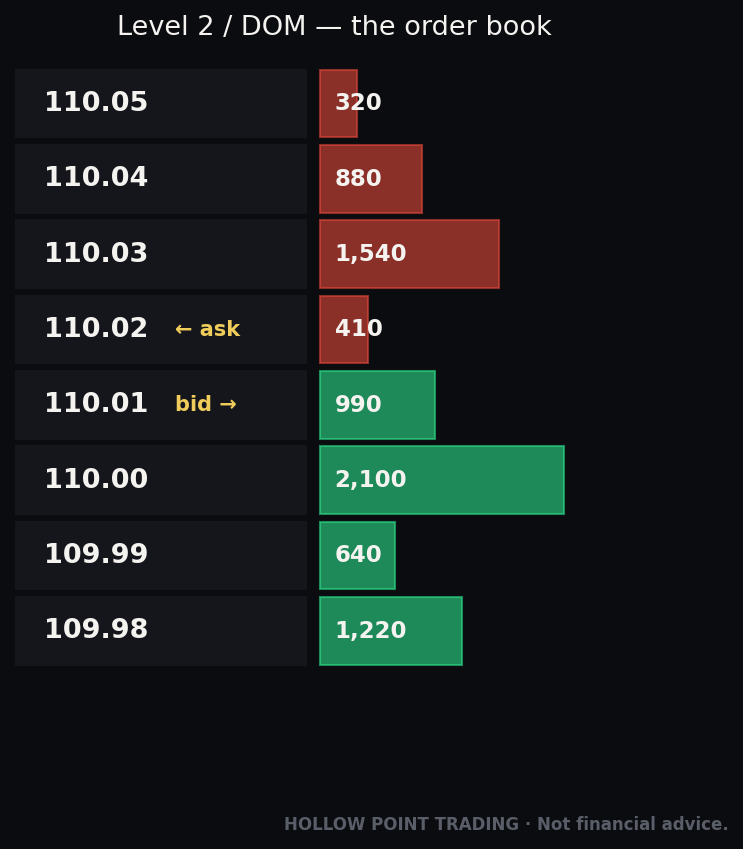
When you're timing an intraday entry at a charted level, Level II (below) tells you whether that level has real liquidity. A support line on the chart with a stacked wall of bids sitting on it on Level II is a level with teeth; the same chart line with thin, scattered bids is a level about to break. The chart says where; Level II says whether it'll hold right now.
The Analyze tab as the veto
The final filter is always the Risk Profile. Even when trend, volume, and Level II all agree, if the Analyze tab shows the trade risks more than your plan allows — or that theta will gut it before your thesis has time to play out — you pass. Confluence gets you interested; the risk profile gets you sized, or gets you out. At Hollow Point the sequence is fixed: find the level, confirm the confluence, then let the Analyze tab and your 1:3 decide whether the trade is worth taking at all.
How It Behaves in Different Market Regimes
The same platform, the same tools, and the same setups behave completely differently depending on what kind of market you're in. A professional adjusts; a beginner runs the same playbook into a wall.
Trending markets
In a clean trend — EMA stack aligned and price marching — the platform's trend tools shine and your job is to stay with the move. Pullback entries into the 12 or 22 EMA work. Trailing stops work, because the trend keeps the stop far from price. Long options work better than usual because a persistent directional move overwhelms theta. In a trend, the mistake is over-managing — taking profits too early, tightening stops into noise, fighting the direction with counter-trend scalps because it "feels extended."
Choppy, range-bound markets
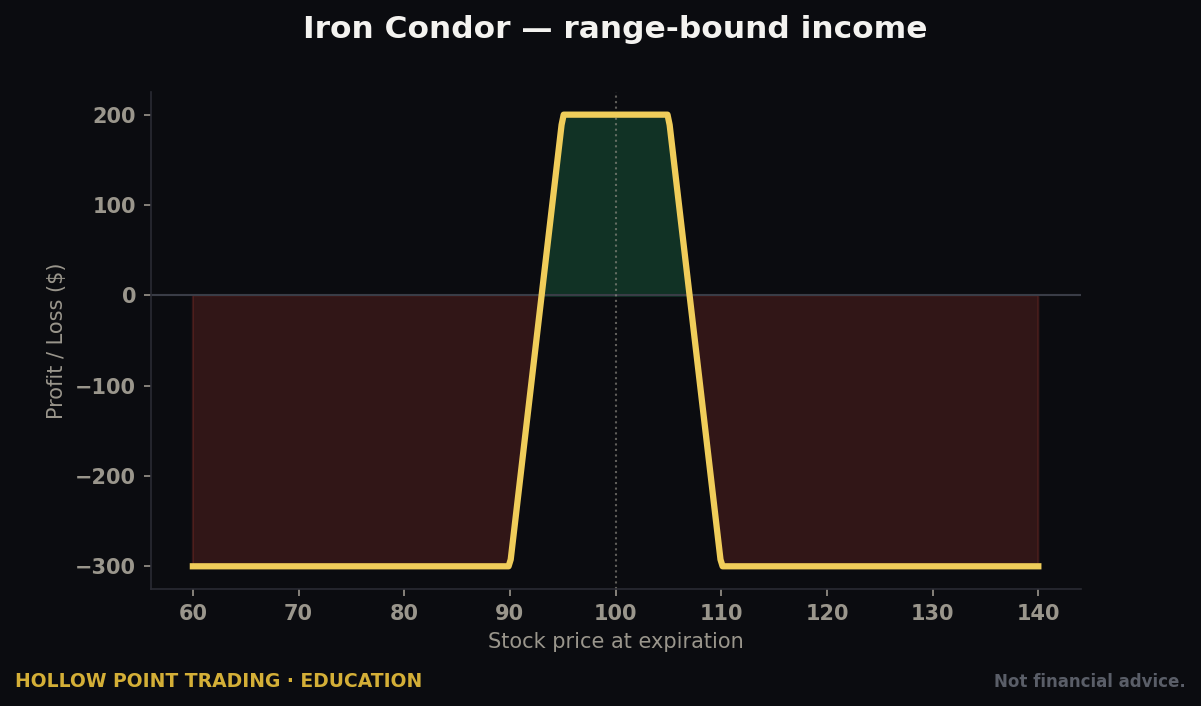
When the EMAs braid together flat and price oscillates in a range, trend setups fail repeatedly — every breakout is a fakeout. This is where the options sellers thrive and the buyers bleed. In chop, long options die to theta while the stock goes nowhere; the Analyze tab's time slider makes this brutally visible. Defined-risk credit structures (iron condors, credit spreads) that profit from time passing and price staying put are the regime-appropriate tool — and thinkorswim's strategy-builder chain assembles them for you. The tell that you're in chop: your trend signals keep firing and keep failing. Believe the failures.
High-volatility markets
When volatility spikes — a market selloff, an earnings event, a macro shock — everything changes. Implied volatility inflates option premiums, so buying options gets expensive and vega risk gets large (you can be right on direction and still lose as IV normalizes). Spreads on the chain widen, so market orders become even more punishing and limit discipline matters more. Stops get run more often by the sheer size of the swings, so you widen them and size down to keep the same dollar risk. The Analyze tab earns its keep here: slide the volatility input to see what happens to your position if IV drops 20 points after an event — for a long option that can turn a directional win into a loss. In high vol, the professional move is usually smaller size, wider stops, and structures that don't depend on IV staying high.
paperMoney: The Simulator You Must Use
paperMoney is thinkorswim's paper-trading mode — the full platform, driven by live market data, executing with hypothetical funds. It is provided strictly for education, and it is one of the great free resources in all of retail trading: you get the entire desktop cockpit, the real chain, the real Analyze tab, the real order tickets — with fake money.

The three jobs of paper trading
Use it for three things. First, learn the platform — every menu path, every order type, every bracket, with zero risk. Fumbling a first-triggers-OCO is free here and expensive live. Second, test strategy — trade a setup fifty times on paper before you trade it once live, and keep a simple log of the results so you know whether the edge is real or imagined. Third, drill discipline — practice placing your 1:3 bracket, honoring your stop, and walking away, until the mechanics are muscle memory.
The honest caveat
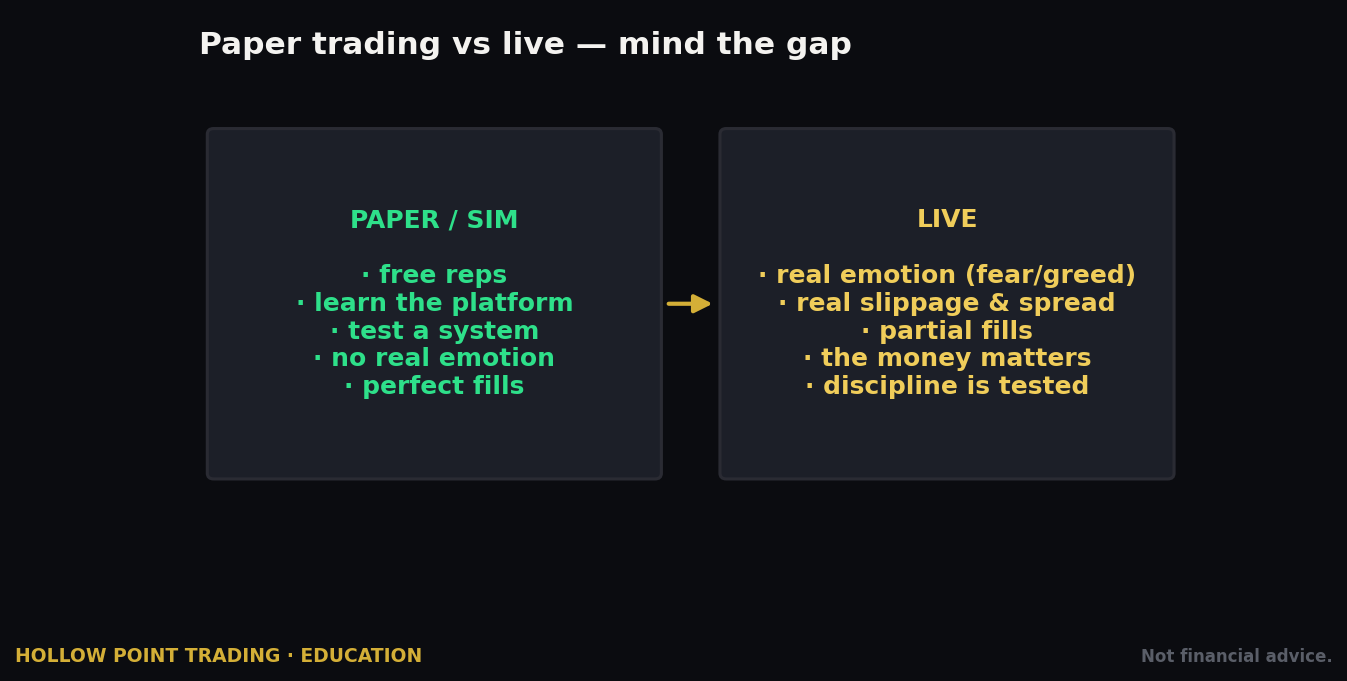
The one honest caveat: paper trading can't replicate the emotion of real money, and simulated fills are often kinder than live ones (you won't feel a wide spread the way a real order does, and in paperMoney a limit at the mid tends to fill more easily than it would live). It builds competence, not psychology. The graduation path that respects this: prove the strategy in paperMoney, then go live at the smallest possible size — one contract, or a handful of shares — so the emotion is real but the dollars can't hurt you. Scale up only after the small-size live version is boring. At Hollow Point Trading the rule is simple: if you can't run it in paperMoney, you have no business running it live.
thinkScript Basics
thinkScript is thinkorswim's proprietary scripting language, and it's the reason power users never leave. It lets you write your own studies, scans, and alerts — encoding your precise technical criteria into the platform.
You don't need to be a programmer
A thinkScript study is usually a few lines: define an input, compute something from price or volume, and plot it. A minimal example — plot the 55 EMA:
input length = 55;
plot EMA = ExpAverage(close, length);
That's a complete, working study. Add it, and a 55-period exponential moving average appears on your chart. Want to color it green when price is above and red when below? A couple more lines. Want an alert every time the 12 EMA crosses the 22? A short script using crosses. Want a scanner that flags every stock in a watchlist where price is rejecting the daily 55 EMA? thinkScript can express it, and the Scan tab will run it across the whole market for you.
The power chain
Where it becomes serious is the combination: thinkScript studies feed the Scan tab (find setups across hundreds of symbols at once), fire alerts (get notified the moment a condition triggers), and pair with conditional orders (semi-automate the response). That chain — custom criteria → scan → alert → conditional order — is how a disciplined trader turns a repeatable edge into a repeatable process without staring at screens all day. You define what a setup is once, in code, and the platform hunts for it while you do other things.
For HPT students building an indicator suite, thinkScript is the natural place to prototype a signal before committing to it. Start by opening built-in studies' source (many are viewable — right-click a study, view sources) and reading how they're written; you'll learn the language fastest by editing something that already works than by staring at a blank editor. A word of caution though: thinkScript is a research and alerting language, not a black box to trade blindly. A script that looks great on the last hundred bars is fitting the past; validate any signal in paperMoney and across regimes before you trust it with money.
Level II & Market Depth
For traders who read order flow, thinkorswim includes Level II and Market Depth as gadgets on the left sidebar — available across desktop, web, and mobile.
Level II shows the best bid and ask from each individual exchange and market maker posting quotes in a stock, option, or future — not just the single best national price, but the stack of competing quotes behind it. Market Depth presents a similar picture: the layered bids and asks across major exchanges, so you can see where size is resting. Together they let you read the immediate supply-and-demand at the tape — where buyers are stacked, where a wall of sellers sits, whether a level has real liquidity behind it or is thin enough to slice through.

Read it with a grain of salt, though: displayed size can be spoofed or pulled the instant price approaches, and hidden (iceberg) orders mean the real liquidity isn't always what's shown. Level II is a read on intent, not a guarantee of what will happen. For most swing and position traders, it's informational, not essential — the daily and hourly chart matter far more than the momentary tape. For active intraday traders — especially scalpers timing entries to the second — it's a core read. Know that it exists here, and that it's genuinely good.
Fees, Commissions & the Payment-for-Order-Flow Reality
thinkorswim's pricing is standard modern-broker pricing, and it's worth knowing to the penny — HPT rule, every number verified.
- Stocks and ETFs: $0 commission on online-listed trades.
- Options: $0 base commission + $0.65 per contract. On a multi-leg trade, the $0 base still applies and the $0.65 hits each contract of each leg. So a 10-contract iron condor (four legs) is 40 contracts of per-contract fees — $26 in and, if you close it, $26 out. No exercise or assignment fees. The per-contract fee is waived on buy-to-close orders priced at $0.05 or less done online — a nice touch for closing out near-worthless short options instead of leaving them on to risk assignment.
- Futures and futures options: $2.25 per contract, per side.
- The platform itself: free. No subscription, no data fee for the standard package, no minimum balance.
On top of these, small exchange, regulatory, and market-data fees can apply depending on the product — pennies, generally, but they exist. Always confirm the current schedule on Schwab's pricing guide, because these numbers do get revised.
Payment for order flow
Now the part most guides skip: payment for order flow (PFOF). When you place a "$0 commission" trade, Schwab often routes it to a wholesale market maker who pays Schwab for that order flow. Per Schwab's own disclosures, the rates are roughly $0.001 per share or less on marketable orders, $0.0033 per share on non-marketable orders, and $0.0006 per share on extended-hours orders — and Schwab's equity order-flow revenue ran into the hundreds of millions of dollars in a recent year. That's how "free" trading is paid for.
Is that bad? Not necessarily — the honest read is nuanced. Schwab states it charges every market maker the same rate for a given flow type and does not trade payment against execution quality or route more flow for more money. But you should know the arrangement exists: your order is a product, and the small gap between the price you get and the theoretical best price is where the economics live. For the vast majority of retail trades the impact is trivial — pennies, dwarfed by the spread you'd pay anyway. For a size trader, execution quality is worth watching, and Schwab publishes routing and price-improvement (SEC Rule 605/606) data you can actually check. The practical defense for everyone: trade liquid products with tight spreads, and use limit orders, and PFOF becomes a rounding error in your results.
Margin, Account Types & the Day-Trading Rules
Account types
The standard individual or joint taxable brokerage account is where active trading and full options approval live. IRAs (Traditional, Roth) are available and can trade options — but capped at Level 2, because the higher levels require margin, which retirement accounts can't use in the ordinary sense. There are also custodial, trust, and business account types. Pick taxable for active trading; use the IRA for tax-advantaged, defined-risk strategies within the Level 2 ceiling. A common professional structure: aggressive directional and short-premium trading in the taxable account where you have full flexibility, and slower, defined-risk premium strategies inside the IRA where the gains compound tax-advantaged.
Margin
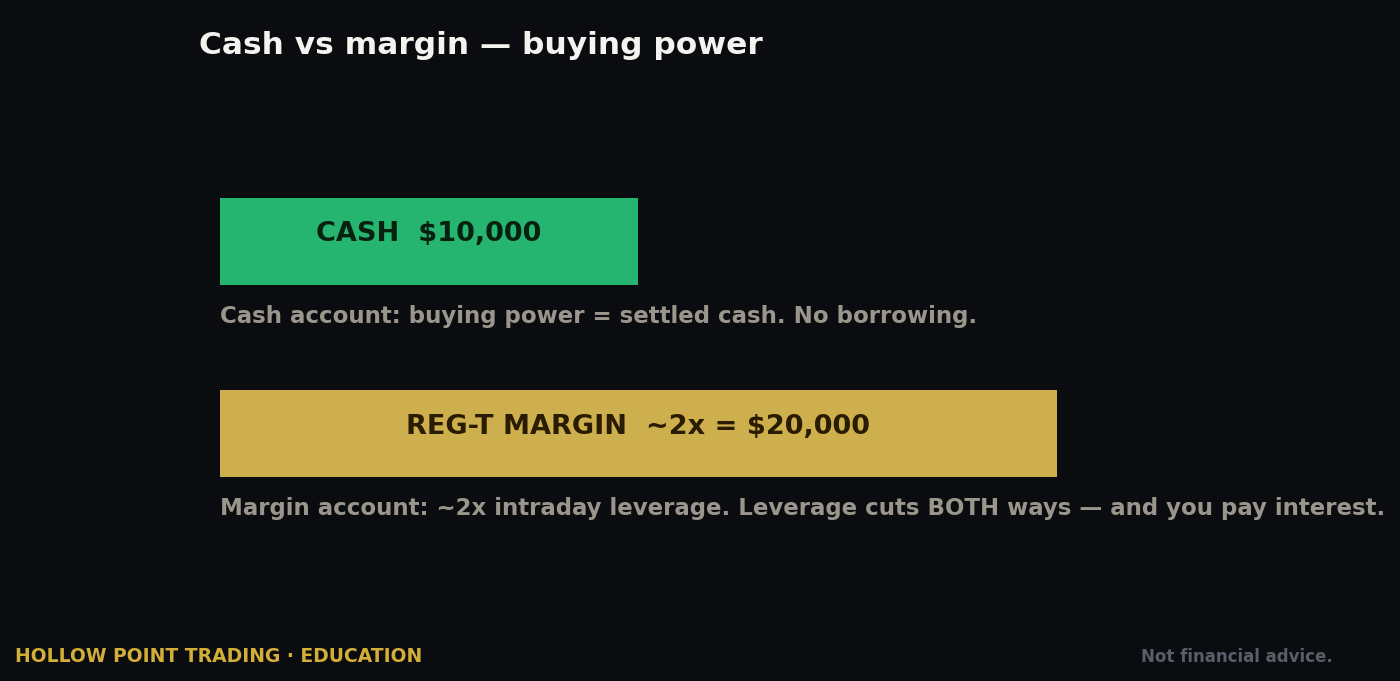
To trade on margin — borrowing against your securities to increase buying power — you need a margin account with at least $2,000 in cash or marginable securities to start borrowing. Margin costs interest: Schwab's base rate was 10.00% as of its last change on 12/12/2025, with your actual rate set by that benchmark plus a spread that shrinks as your balance grows (bigger accounts pay less). Margin cuts both ways — it magnifies gains and losses alike, and a margin call can force liquidation at the worst possible moment, selling your positions at the bottom of a move to bring your equity back in line. Respect it. The professional view of margin is not "free buying power" but "a loan that can be called at the exact instant you least want to sell."
The day-trading rules — a current change
For 25 years, the Pattern Day Trader (PDT) rule flagged anyone making four or more day trades in five business days in a margin account and forced them to keep $25,000 in equity. That framework has been overhauled. The SEC approved FINRA's proposal to eliminate the $25,000 pattern-day-trader minimum and retire the PDT designation, replacing it with intraday margin standards tied to your actual market exposure. Schwab has implemented the change — it no longer counts day trades the old way or opens new PDT-designated accounts, and accounts formerly flagged below $25,000 have had that status removed and can day-trade on their available buying power.
This is a big deal, and it's new, so verify the current state on your own account before you rely on it. The old $25k wall is coming down; the new regime asks you to keep equity proportional to your real intraday risk. The HPT translation doesn't change either way: your position size is governed by your risk plan and your 1:3, not by whatever the minimum-equity rule happens to be this quarter. Regulation setting a floor was never your risk management. Your rules are. A trader who needed the $25k rule to stop them from over-trading never had a system in the first place.
How the Pros Use It Differently from Beginners
Same platform, radically different behavior. The gap between an amateur and a professional on thinkorswim shows up in habits, not features.
They start from risk, not reward
A beginner opens the chain and thinks "how much could I make?" A professional opens the Analyze tab first and thinks "what's my max loss, and does it fit my plan?" The pro sizes the position from the stop backward — decide the dollar risk, then let that determine the number of contracts — so every trade risks roughly the same amount regardless of how excited they are about it. Beginners size from conviction; pros size from risk. That single inversion is most of the edge.
They automate discipline
Beginners watch positions and make exit decisions live, in the heat of the move, which is exactly when judgment is worst. Pros encode the exit into a first-triggers-OCO bracket at entry, so the target and stop are working before emotion arrives. The pro has already made the hard decision while calm; the market just executes it.
They keep the workspace lean
A beginner's screen is forty gadgets and twenty studies — clutter mistaken for sophistication. A pro's screen is a clean chart with the EMA 12/22/55 template, the chain, the Monitor tab, and maybe one gadget. They add complexity only when a specific question demands it, then remove it again. The signal-to-noise ratio of the workspace mirrors the signal-to-noise ratio of the trading.
They respect the regime
Beginners run one playbook — usually buying calls and puts — in every market and wonder why it works some weeks and bleeds others. Pros read the regime first (trend, chop, or high-vol from the EMA stack and the volatility environment) and change tools to match: directional longs in trends, defined-risk credit structures in chop, smaller size and wider stops in high vol. Same platform, three different toolkits deployed at the right time.
They treat paperMoney and OnDemand as a gym, not a toy
Beginners either skip the simulator or treat a paperMoney win as proof of genius. Pros use OnDemand to rehearse specific setups hundreds of times and use paperMoney to validate a new strategy with a logged sample before it ever touches real money — and they expect the live version to be harder than the paper version, so they scale in slowly.
Strengths & Weaknesses vs Peers
Where thinkorswim wins, decisively
- The options toolkit. Analyze tab, Risk Profile, live probabilities, thinkBack, OnDemand, the strategy-builder chain — no free platform matches this stack. For understanding an options position before you enter, it's the best retail tool that exists.
- paperMoney. A full-power simulator on live data, free. Peerless for learning.
- thinkScript. Real, deep customization for anyone willing to learn it, feeding scans, alerts, and conditional orders.
- Depth and configurability. Multi-monitor layouts, custom studies, professional charting, Level II, saved templates.
- Free, on Schwab's balance sheet. All of it bundled with an account, backed by one of the largest, most stable brokers in the world — no small thing when you're trusting a firm with your capital.
Where it lags
- The learning curve. thinkorswim is dense. Beginners are routinely overwhelmed. This is the number-one, honest knock — the platform's greatest strength and its greatest barrier are the same thing.
- Web and mobile are real steps down from desktop — fine for managing, thin for analysis.
- No fractional shares on the thinkorswim ticket the way some newer apps do it — simple investing UX isn't its strength (Schwab's other tools cover that).
- PFOF economics exist here like at most zero-commission brokers; pure price-improvement obsessives sometimes prefer routing they control directly.
Versus the field
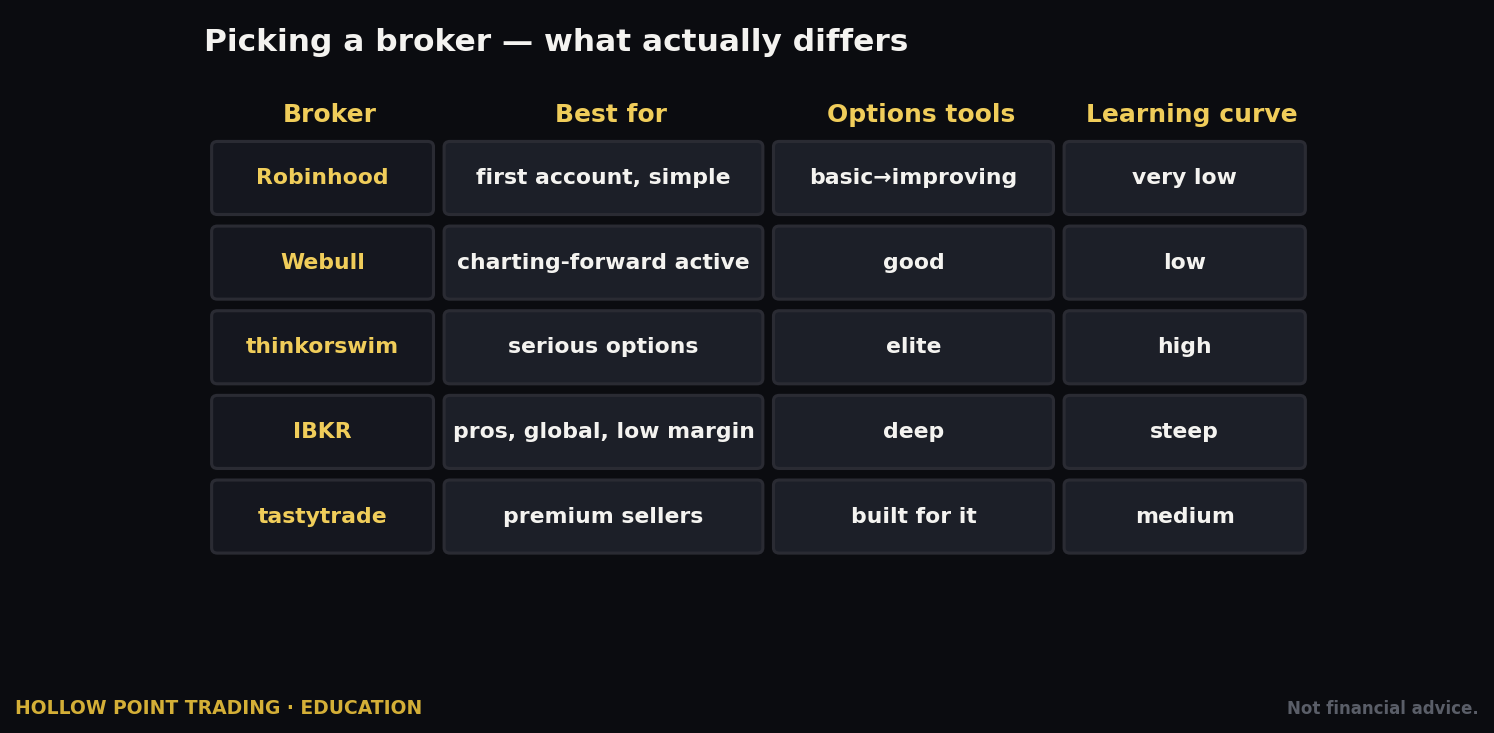
Fidelity is a superb all-around broker with a friendlier learning curve but a shallower options-analysis bench. Interactive Brokers arguably beats it on raw execution, margin rates, and global reach but is even less beginner-friendly and its interface is a maze. Robinhood and its kin win on simplicity and lose — badly — on depth; there's no Analyze tab, no real risk visualization, no scripting. tastytrade is the closest philosophical rival for options-first traders, built by some of the same people, with a slick premium-selling workflow — but thinkorswim's analysis suite and thinkScript still run deeper. For the specific job of understanding and managing options positions with professional tools at zero cost, thinkorswim sits at or near the top of the retail world.
Common Mistakes on This Platform
The mistakes here are specific to thinkorswim's power, and every one is avoidable.
1. Skipping paperMoney. The single biggest error. You have a free, full-power simulator and you go live untrained, learning the platform's quirks with real money. Run everything on paper first — the platform mechanics, the strategy, and the discipline.
2. Market orders on options. Option spreads can be wide. A market order on a $1.20 × $1.60 option hands the market maker forty cents per contract. Use limit orders and price them near the mid. This one mistake, repeated, quietly costs more than commissions ever will.
3. Botching the bracket's time-in-force. Mismatched TIFs on an OCO or first-triggers-OCO cause behavior beginners can't explain — a stop that expires overnight and leaves the position naked, a leg that won't cancel. Match every leg's TIF and check the working-orders view after entry.
4. Chasing the highest options level. Getting approved for Level 3 does not mean you understand naked risk. Trade the level that matches strategies you can actually risk-profile and size at 1:3. The approval is permission, not readiness.
5. Reading probabilities as promises. The probability numbers are IV-derived estimates, not forecasts. A 75% trade loses one in four, and the losers cluster. Size on edge, not on false certainty, and never bet the account on a "high-probability" trade.
6. Ignoring vega around events. Buying options into earnings because you expect a big move, then losing money when the stock moves your way — because implied volatility collapsed after the print and vega worked against you. The Analyze tab's volatility slider shows this in advance. Model the IV crush before you buy the event.
7. Drowning in the interface. thinkorswim will happily let you cram forty gadgets and twenty studies onto one screen. Clutter is not sophistication. Build a clean workspace — chart with your EMA 12/22/55 template, the chain, the Monitor tab, one or two gadgets — save it, and grow deliberately.
8. Ignoring the Analyze tab. If you trade options here and never open Risk Profile, you're driving a race car in first gear. That tool is the reason to be on this platform. Use it on every options trade, before entry, every time.
9. Over-managing a winning trend trade. Taking profit at the first green, tightening stops into normal noise, fighting the trend with counter-scalps because it "feels extended." In a real trend, the mistake is usually doing too much, not too little. Let the bracket work.
10. Trading the wrong tool for the regime. Buying long options in dead chop and watching theta eat them, or selling premium into a violent trend and getting run over. Read the regime from the EMA stack first, then pick the structure. The same setup is a good trade or a bad one depending on the environment.
11. Confusing paperMoney success with skill. Paper fills are kinder and paper emotion is nonexistent. A month of simulated wins is a competence signal, not a green light to size up. Go live small and let real emotion recalibrate you.
12. Confusing the order actions. Choosing "buy to open" when you meant "sell to close" and accidentally doubling a position instead of exiting it. Slow down on the ticket; read the action, the quantity, and the TIF before you hit confirm.
FAQ
Is thinkorswim really free? Yes. The platform — desktop, web, mobile, paperMoney, Analyze, thinkScript, all of it — carries no subscription, no platform fee, and no minimum balance. You pay per-trade commissions ($0 on stocks, $0.65/contract on options, $2.25/side on futures) and the small regulatory fees everyone pays. That's it.
Do I have to move to Schwab from TD Ameritrade? The migration is already done. TDA's platforms are retired; thinkorswim now lives inside Schwab, reached with Schwab credentials. If you had a TDA account it was transitioned for you.
Can I trade options in an IRA? Yes, up to Level 2 (covered calls, long calls/puts, and defined-risk spreads). The higher levels require margin, which retirement accounts can't use in the ordinary sense, so naked selling is off the table in an IRA.
How long until I can actually trade? Roughly a week end to end: a day or so for approval, two-plus business days for ACH funds to clear, and then as much paperMoney time as you need before going live. Don't compress the practice.
Is paperMoney exactly like live trading? Close, but not identical. It uses live data and the full platform, but simulated fills are often kinder than real ones and there's no emotional cost to a loss. Treat it as a competence gym; add the psychology by going live at tiny size afterward.
What's the deal with the $25,000 day-trading rule? The old Pattern Day Trader $25k minimum has been overhauled and the PDT designation is being retired in favor of intraday margin standards tied to real exposure; Schwab has implemented the change. Verify your own account's current status before relying on it — and either way, let your risk plan, not the rule, govern your size.
Should I use desktop, web, or mobile? Analyze and place considered trades on desktop. Use web to trade from a machine you can't install software on. Use mobile to monitor and to manage or exit a position when you're away — not to make fresh entry decisions.
Is payment for order flow costing me money? On liquid products traded with limit orders, the impact is a rounding error. Trade tight-spread names, use limits, and it's negligible for retail size. Larger traders should watch execution quality and can check Schwab's published routing data.
What EMAs should I use? The Hollow Point stack is 12, 22, and 55 — not the generic 9/21. Save it as a chart template so every symbol wears it automatically. The daily 55 is your swing bias tell.
Quick-Start Cheat-Sheet
Print this. It's your first-week runbook.
- Open the account at Schwab.com → individual brokerage. No minimum. Answer the experience questions honestly — it sets your options approval.
- Fund it via ACH (free; allow a couple of business days to clear). Wire if you need it same-day.
- Enable and download thinkorswim — desktop is home base. Web for borrowed machines, mobile for monitoring.
- Flip on paperMoney immediately. Do everything below in the simulator first, and log your results.
- Build your chart template: EMA 12/22/55 (the HPT stack), your core studies, saved so every chart wears it. The daily 55 is your bias tell.
- Work the timeframes top-down: daily for bias, hourly for the level, 5/15-minute for the entry. The small timeframe times the trade; it never overrides the large one's direction.
- Apply for options when ready. Levels: 0 covered calls, 1 long calls/puts, 2 spreads (IRA max), 3 uncovered. Trade the level you understand.
- Read the chain on the Trade tab: strikes down the middle, calls/puts, bid/ask, volume/OI, and the Greeks — delta (move + rough odds), gamma (twitchiness), theta (daily decay), vega (IV sensitivity). Add the Prob-ITM column.
- Place trades with LIMIT orders, priced near the mid. Never market an option spread.
- Encode discipline in the ticket: use first-triggers-OCO (bracket) so entry auto-launches your target and stop at 1:3. Match every leg's time-in-force. Check the working orders after fill.
- Analyze before you enter: open Risk Profile on every options trade — see max gain, max loss, breakevens, and how time and volatility move the curve. Model the IV crush before any event trade.
- Stack your confluence: trend (EMA stack) + structure (volume profile) + options odds (probability) all pointing the same way, with Level II confirming the level has real bids. Any one alone is not a trade.
- Match the tool to the regime: directional longs in trends, defined-risk credit structures in chop, smaller size and wider stops in high vol.
- Know the costs: stocks $0; options $0 + $0.65/contract; futures $2.25/contract/side; no exercise/assignment fees; buy-to-close ≤ $0.05 fee-waived; platform free. Understand that PFOF pays for "free."
- Know the current day-trading rules: the old $25k PDT wall has been overhauled — verify your account's current status before relying on it. Size by your risk plan regardless.
- When in doubt, verify the live screen. UI changes; your screen is the source of truth.
thinkorswim rewards the trader who treats it like a craft. It is deep because trading is deep, and the platform refuses to pretend otherwise. Learn it in paperMoney, encode your rules into your order tickets, analyze every options trade before you place it, read the regime and pick the right tool, and let the machine execute the discipline you've already decided on while calm. That's the whole game — a professional cockpit in the hands of a trader who came prepared.
Bound by rules, feared by trade.