
Here's the thing nobody tells you when you're starting out: the platform where you place your trades and the platform where you decide your trades are usually two different places. Your broker fills the order. But the analysis — the levels, the trend read, the confluence — happens somewhere else. For most of the market, that somewhere is TradingView.
It's the most-used charting platform on the planet, and it earned that spot by being the one tool that talks to everything: stocks, futures, forex, crypto, bonds, indices, all in one chart engine, all with the same drawing tools and the same indicator library. Analysts quote it. Prop firms run on it. Retail lives in it. And critically for us — it's the engine Hollow Point Trading's entire top-down read is built on, from the monthly bias all the way down to the 1-minute trigger.
This guide teaches you TradingView as a working tool, not a feature list: what it is, how to set it up, how to connect a broker and trade from the chart, how to read it top-down, how it behaves in different market regimes, where it combines with the rest of your toolkit, and exactly where its walls are so you don't slam into them. We'll define every term once, in plain English, and then we'll go deep. By the end you'll be able to open a chart Monday morning and actually use it — not just click around it.
One honesty note up front, and it runs through this whole piece: TradingView's interface changes constantly. Menus move, buttons get renamed, plans get re-tiered, features get added and occasionally pulled. Every menu path and price here was checked against 2026 sources, but treat exact clicks as a map, not GPS. When I say "verify the current screen," I mean it — the workflow stays stable even when the pixels move. Learn the logic of where things live and you'll find any button no matter what they rename it to.
What It Is & Who It's Best For
TradingView is a charting and analysis platform — a browser-based (and desktop, and mobile) chart engine with a massive public library of indicators, social features, screeners, alerts, and, increasingly, the ability to route real orders to a connected broker.
The distinction that matters most: TradingView is not primarily a broker. It's where analysis lives. It can place trades — through broker integrations, which we'll cover in depth — but its core job is to be the best place in the world to look at a chart and decide what to do. Think of it as the cockpit. The broker is the engine. You can wire the cockpit to the engine, but they're different machines, owned by different companies, governed by different rules.
Who it's genuinely built for
- Anyone who is serious about reading charts. If you're going to make decisions off structure, EMAs, volume, and levels, this is the reference tool. Everything else is measured against it.
- Multi-asset traders. One layout, one skill set, works across stocks, futures, forex, and crypto. The muscle memory you build on NQ futures transfers directly to AAPL or EURUSD or BTC — same drawing tools, same interval box, same everything.
- Anyone building or borrowing custom indicators. Pine Script (TradingView's scripting language) and the public library are unmatched. This is precisely why HPT's entire indicator arsenal is built in Pine — the tape readers, the level tools, the EMA framework — because the only way to trust a signal is to have written the logic yourself.
- Traders who want broker flexibility. You're not married to one broker's ugly platform. You analyze in TradingView and route to whichever connected broker you like, and you can switch brokers without relearning your charts.
Who it's not ideal for as a sole tool
Someone who wants deep options analytics — full Greeks, sophisticated options chains, complex multi-leg spreads, options-specific risk graphs — baked in. That's still stronger on dedicated broker platforms like thinkorswim. TradingView is catching up on options, and fast, but it is not its center of gravity. If your whole edge is options structure, TradingView is your chart and your broker platform is your options desk. Know that split going in and you won't be frustrated by it.

Opening & "Funding" an Account (Steps)
This is the first place the broker-guide template breaks down for TradingView, and it's worth being crystal clear about, because beginners get this backwards constantly.
You do not fund a TradingView account. TradingView doesn't hold your money. There's no cash balance, no wire, no ACH transfer into TradingView. You fund your broker. TradingView is the charting subscription that sits on top. When you pay TradingView, you're paying for charts and features — nothing that ever becomes trading buying power.
So "opening an account" is really two separate acts.
Act 1 — Create your TradingView account (free, 2 minutes)
- Go to tradingview.com and click Sign up (top right).
- Register with email, Google, Apple, or another single sign-on.
- Confirm your email. You're now on the free Basic plan.
- Set your default watchlist and a couple of tickers so the chart opens on something you care about.
That's it. No money changes hands. You can chart, draw, add a couple of indicators, and set a few alerts for exactly zero dollars. Spend a week here before you pay for anything.
Act 2 — Fund the broker you'll trade through (separate, later)
When you're ready to place real trades from the chart, you open and fund an account at a supported broker (Interactive Brokers, tastytrade, OANDA, FOREX.com, AMP Futures, and 100+ others — full list at TradingView's broker directory, which updates regularly). That's where your KYC (know-your-customer identity verification), your deposit, and your buying power live. We'll connect it in the "first trade" section.

Choosing your TradingView plan
The free Basic plan is genuinely usable for learning but tight. As of 2026 the paid ladder looks roughly like this (verify current pricing — TradingView reprices and reshuffles tiers, and monthly-vs-annual billing changes the number a lot):
- Basic (Free): ad-supported, 1 chart per tab, 2 indicators per chart, ~5,000 historical bars, 1 watchlist (~30 symbols), 3 active price alerts, 0 technical/indicator alerts.
- Essential (~$14.95/mo): ad-free, more indicators per chart, more alerts, more history, 2 charts per tab. The cleanest first upgrade.
- Plus (~$29.95/mo): 4 charts per tab, ~100 alerts. The sweet spot for most active traders.
- Premium (~$59.95/mo): 8 charts per tab, ~400 alerts, non-expiring alerts, more history, second-based intervals, volume candles.
- Ultimate (~$199.95/mo billed annually): 16 charts per tab, up to 50 indicators per chart, ~1,000 alerts.
The single most painful free-plan limit for a top-down trader is 2 indicators per chart. HPT's read uses more than two things at once — EMA stack, VWAP, volume, RSI, a custom level tool. If you're going to run confluence, you'll outgrow free fast. The second most painful is 0 technical alerts on free — meaning any alert driven by an indicator or Pine script requires a paid tier. Start free to learn the interface; upgrade to Essential or Plus when the walls actually start hitting you, not before. Don't pay for capacity you're not using yet.
A quick worked cost example
Say you're a part-time swing trader on U.S. stocks. Your realistic stack: Plus at ~$29.95/mo (four charts, 100 alerts) plus, if you want live U.S. exchange data rather than the free delayed feed, a real-time data subscription for the exchanges you trade (often a few dollars a month per exchange). Your broker commissions are separate and on top — say a discount broker at effectively near-zero commission on stocks. So your monthly charting overhead might be ~$35, entirely independent of how many trades you place. Contrast a day trader running futures who wants Premium for second-based bars and more alerts (~$60/mo) plus CME data — the charting bill rises with what you demand of the chart, never with your trade count. That separation is the whole mental model: charting cost and trading cost are two different meters.
The Interface & Layout (Web, Desktop, Mobile)
TradingView runs in three places, and they share a brain — your layouts, watchlists, drawings, and alerts sync across all of them through your account. Log in on a new machine and your whole world is there.

The web platform (in any browser) is the full experience and where most people live. The Desktop app (downloadable for Windows/Mac/Linux) is the same interface in a standalone window — faster, multi-monitor friendly, supports more simultaneous connections, and it's what HPT's automation drives for the ladder screenshots. Mobile (iOS/Android) is a genuinely good companion for alerts and quick reads, not for serious markup — you manage from it, you don't analyze on it.
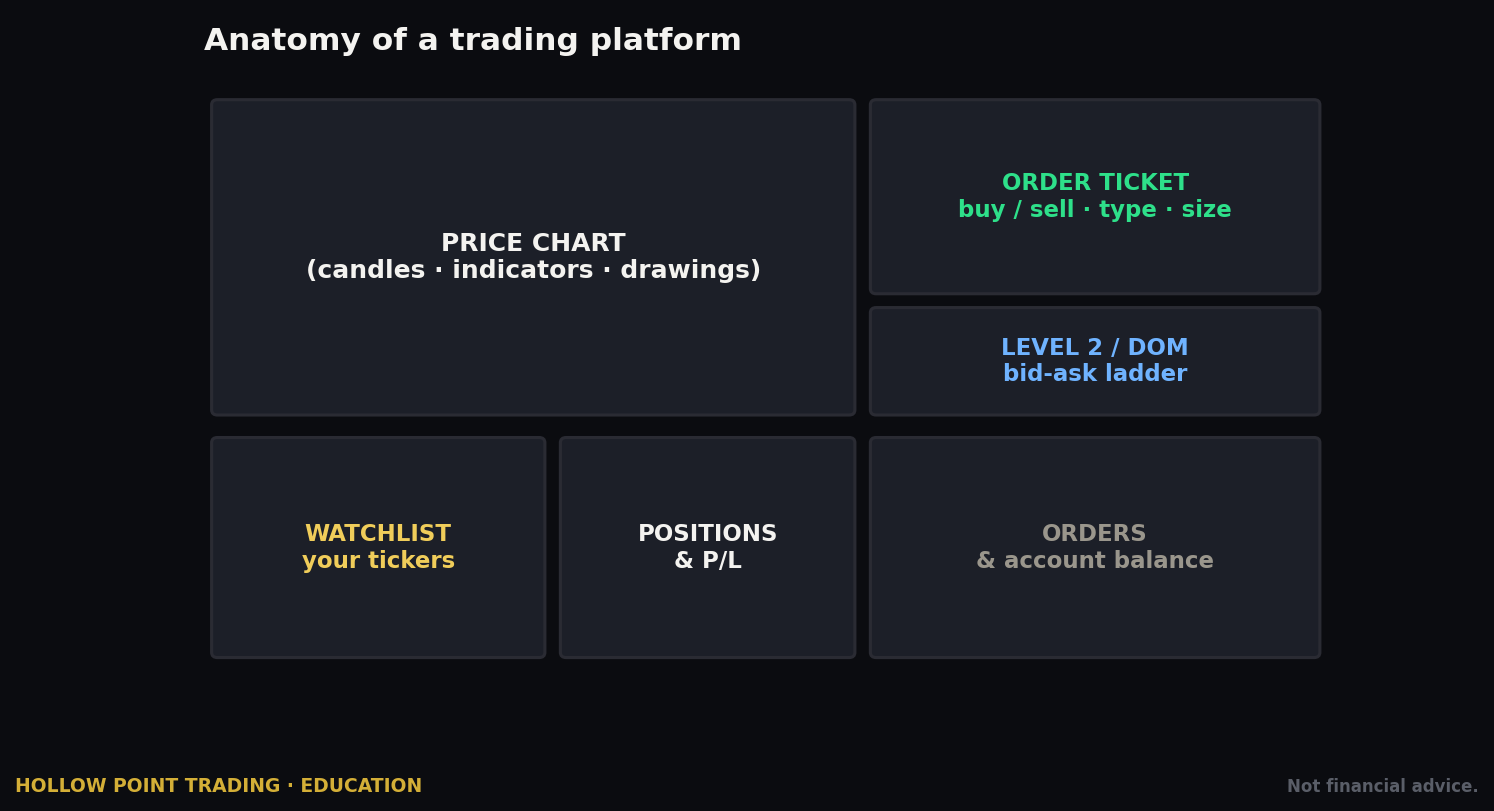
The five regions of the chart screen
Learn the anatomy — once you know where the five regions are, everything else is just clicking around.
- Top toolbar (horizontal, across the top): symbol search (click the ticker, type to change it), the timeframe/interval selector, chart type selector, Indicators button, alert button, bar replay, layout controls, and the compare/multi-chart controls. This is command central.
- Left toolbar (vertical, down the left edge): the drawing tools — trend lines, horizontal rays, Fib retracement, rectangles, text, measure. Your markup toolkit.
- The chart itself (center): price action. Scroll to zoom time, drag the price axis to zoom price, drag the chart body to pan.
- Right sidebar: watchlists, alerts, the news feed, the details/data window, hotlists, and calendar. Toggle these with the icons on the far right.
- Bottom panel: Stock Screener, Pine Editor (where you write/edit scripts), Strategy Tester, and — the important one for this guide — the Trading Panel, where a connected broker lives. Drag this panel up to expand it.

Navigation habits to build on day one
Two things to burn into muscle memory immediately: click the ticker symbol and just start typing to change symbols (fastest thing in the app), and learn that the interval box (the "5m", "1D", etc. near the top-left) is where you change timeframe. Type a number and a letter — 15 then Enter for 15-minute, 1D for daily — you don't have to open the dropdown. Beyond those, learn these keyboard moves and you'll move twice as fast as someone mousing everything: Alt+H drops a horizontal line, Alt+T a trend line, Alt+F a Fib, the comma/period keys step Bar Replay, and hold Shift while drawing a trend line to snap it level. Speed on the chart is not a vanity — the faster you can mark up, the more of your attention stays on the read instead of the mechanics.
Timeframes & Chart Types
Timeframes (intervals) are the resolution of each candle. TradingView covers the whole ladder — from seconds (on higher tiers) and 1-minute up through 2m, 3m, 5m, 10m, 15m, 30m, 1H, 2H, 4H, daily, weekly, monthly, and beyond. You can also type custom intervals (e.g., a 6-minute or 45-minute chart) right into the interval box, which matters more than it sounds — a 4-hour on a 24-hour futures market and a 4-hour aligned to the cash session are different charts, and custom intervals let you build the one your strategy actually needs.
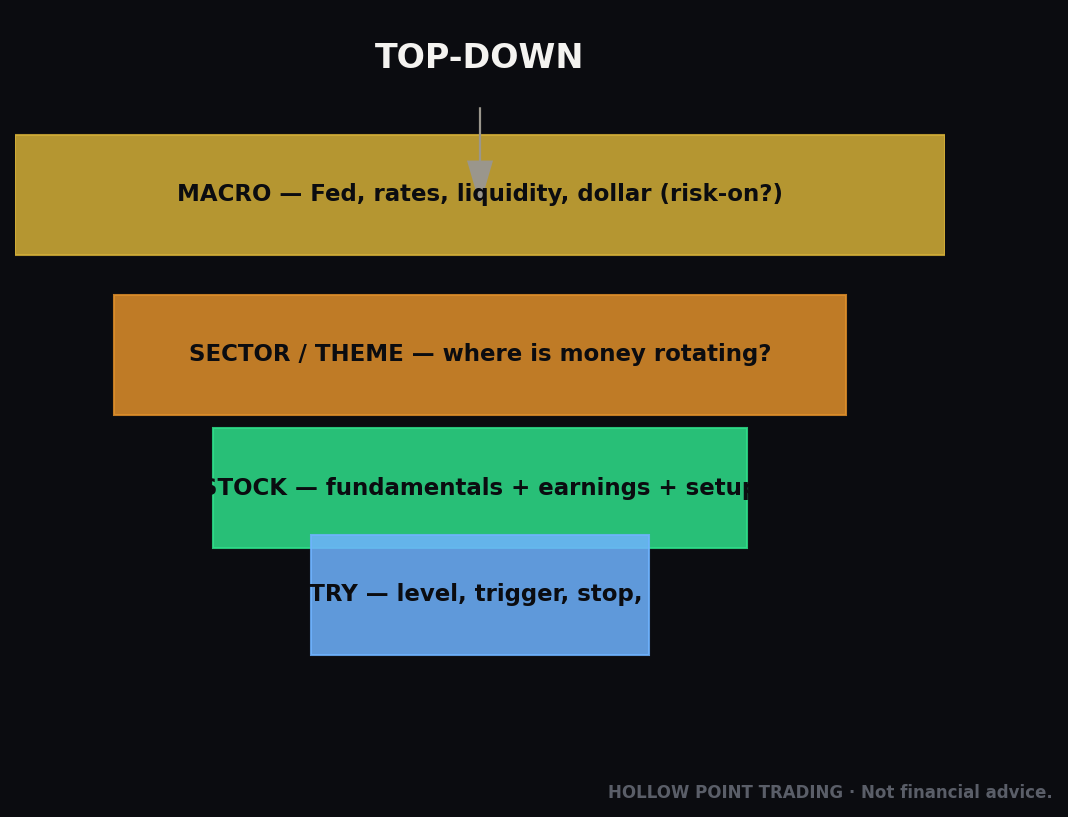
This ladder is the top-down read. HPT's standing process walks a symbol from the 1-minute all the way to the 3-month, and every rung tells you something a different rung can't. The monthly gives you bias. The daily gives you the trend and the 55-EMA tell. The hourlies give you structure. The 5m and 1m give you the trigger. Same chart engine, same tools, all the way down — that consistency is exactly why TradingView is the backbone.

How timeframes actually stack — a worked example
Say NQ is your symbol on a Tuesday. On the monthly you see price above a rising structure — bias is up, no argument. On the daily price is holding above the 55-EMA and the 12/22/55 stack is fanned bullish — trend confirmed. Drop to the 1-hour and you find price pulling back into a prior breakout shelf at, say, 20,150, right where the daily's rising VWAP-anchor and a Fib golden pocket overlap. Now go to the 5-minute for the trigger: you're not buying blindly into 20,150, you're waiting for the 5m to print a higher low and reclaim its own 22-EMA at that shelf. The 1-minute is only for fine-tuning the entry once the 5m has given the go. Notice the flow: higher timeframes grant permission, lower timeframes give timing. Beginners invert this — they find a pretty 1-minute pattern and go looking for a story to justify it. That's backwards, and TradingView's ladder makes doing it the right way effortless because every rung is one keystroke away.
Chart types change how price is drawn
- Candlesticks — the default and the standard. Open, high, low, close in one bar; color tells you up or down. This is what you'll use 95% of the time.
- Bars (OHLC) — same data, thinner presentation, favored by some old-school tape readers who find candles visually loud.
- Line / Area — close-only. Good for seeing the clean shape of a trend or a longer-term structure without candle noise. Excellent for spotting a pattern on a busy monthly.
- Heikin Ashi — smoothed candles that filter noise and make trends visually obvious. Powerful for trend-following, but the prices shown are averaged, not real — never read an exact entry, stop, or target off a Heikin Ashi candle. Use it to see the trend, then flip back to real candles to trade it.
- Renko, Line Break, Kagi, Point & Figure — specialty types that strip out time and print only on price movement. Niche, but useful for pure structure reads and for de-cluttering a choppy market.
Beginners should stay on candlesticks until they know exactly why they'd switch. A chart type is a lens, not a strategy.
Adding Indicators & the Public Library
Click Indicators (top toolbar, the fx or "Indicators" button). A window opens with several categories, and this is one of TradingView's superpowers.
- Technicals — the built-in library: Moving Averages, RSI, MACD, Bollinger Bands, VWAP, Volume, Ichimoku, and a couple hundred more, all professionally maintained.
- Community Scripts / Public Library — tens of thousands of user-published indicators written in Pine Script. Search a concept ("order blocks," "supertrend," "session breaks") and you'll find dozens of free versions.
- My scripts — anything you (or a suite like HPT's) have written or saved.
- Financials & other data — fundamentals you can plot right on the chart (earnings, revenue, debt).

To add one: search its name, click it, it drops onto the chart. Click the indicator's name on the chart to reach its settings (gear icon) — inputs like length and source, and the style tab for colors and visibility.
The repainting trap — read this twice
A hard, practical warning about the public library: anyone can publish anything. A five-star, 10,000-boost indicator can still be repainting garbage. Repainting means the indicator changes its past signals after the fact — it looks psychic in hindsight and useless in real time. The tell is a script whose historical signals are almost perfect, always catching the exact top and bottom. Real markets don't hand you that; if an indicator claims to, its logic is looking at data that wasn't available yet at the time the signal supposedly fired.
Before you trust any community script, do two things. First, test it in Bar Replay — step forward bar by bar and watch whether a signal that's on the bar stays on the bar as new candles form, or quietly moves. Second, if you can read even a little Pine, open the source and look for the tells: request.security calls pulling higher-timeframe data without proper lookahead handling, or logic that references the current bar's close before it's closed. This is precisely why HPT builds and audits its own Pine suite instead of trusting the crowd's — you have to know what the code does.
The HPT indicator set on the chart
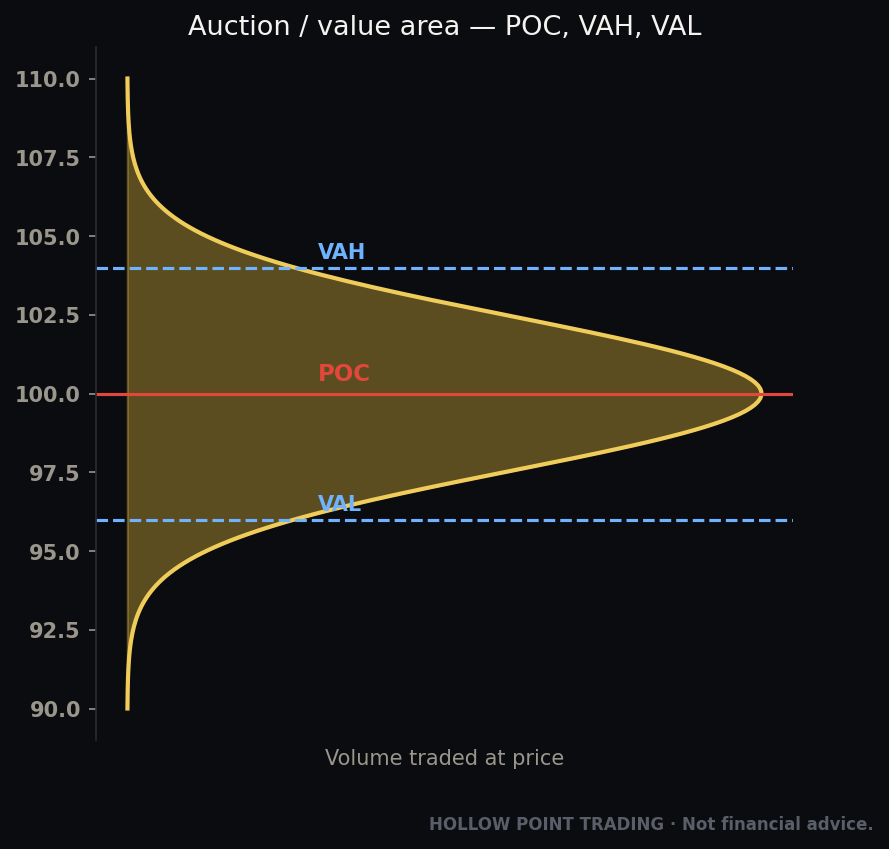
For the top-down read specifically, the indicators that go on the chart are: EMA 12/22/55 (the trend framework — the daily 55 is the bias tell), VWAP and anchored VWAP, volume, RSI, MACD, and an anchored volume profile for POC/value area. On the free plan's two-indicator limit you can't run all of that — another reason confluence work wants a paid tier. If you're forced to pick just two to start, run the EMA stack and VWAP; those two carry most of the intraday read on their own.
Drawing Tools & Alerts
The left toolbar is your markup kit, and markup is where reading becomes trading. A chart with no marks on it is a chart you haven't thought about yet.
The tools you'll use constantly
- Horizontal Line / Ray — for levels. Prior day high/low, session high/low, round numbers, your drawn support/resistance. The bread and butter.
- Trend Line — structure, channels, trendlines.
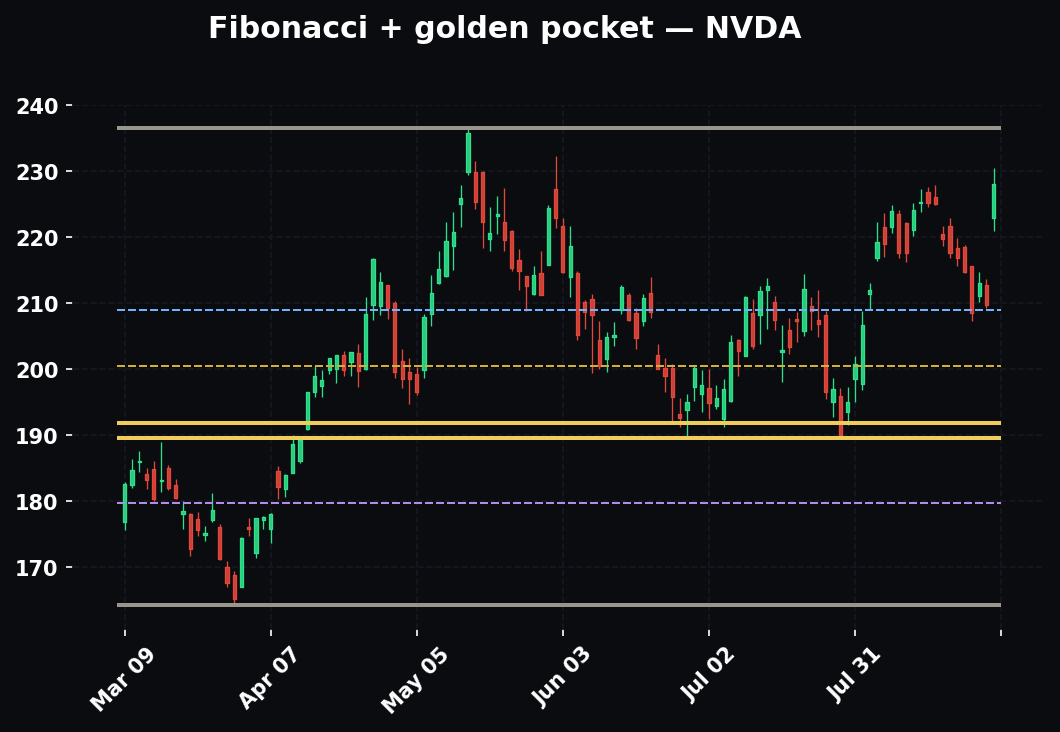
- Fib Retracement — drag from swing low to swing high (or reverse) and it plots the retracement levels, including the golden pocket (0.618–0.65), the zone HPT watches for entries on a pullback.
- Rectangle / Zone — supply/demand zones, ranges, FVGs (fair value gaps).
- Text & Notes — label your reasoning right on the chart, so tomorrow-you knows what today-you was thinking.
- Measure tool — drag to see the price move in % and points, and the bar count. Use it before every trade to sanity-check your reward-to-risk in one drag.

Drawings save to your layout and sync across devices. You can lock them (so you don't nudge a level by accident), set them to appear on all timeframes or just one, and template a set of favorite tools so your markup kit is one click away. A pro tip that saves real money: set your key levels to appear on all timeframes so a line you drew on the daily is visible when you drop to the 5m to trigger — that's how a higher-timeframe level stops you from taking a lower-timeframe trade straight into a wall.
Alerts — the chart watching for you
Alerts are how the chart watches the market so you don't have to stare at it. Click the alert button (top toolbar or right-click a price level → Add Alert). You can trigger an alert on:
- A price crossing a level,
- An indicator condition (RSI crosses 30, price crosses an EMA, MACD cross),
- A drawing (price hits a trendline or a horizontal you drew),
- A Pine Script condition from a custom indicator.
Alerts can fire as a pop-up, email, mobile push, or a webhook (an automated message to an external service — this is how people wire alerts to bots and automated systems). Remember the plan limits: free gives you 3 price alerts and zero technical/indicator alerts, and lower tiers expire alerts after ~2 months. Alerts are one of the biggest reasons to upgrade.
An alert workflow that keeps you sane
Don't set forty alerts. Set the handful that represent decisions. A clean setup: one alert a few ticks above your entry level and one a few ticks below, so you get pinged as price approaches the zone from either side — not when it's already through it. Then, on a drawn trendline that defines your trade, one alert on the break. Now you can close the tab and live your life; the chart taps you on the shoulder only when something you pre-decided matters actually happens. That's the difference between watching the market and hunting it: alerts turn a screen-staring habit into a patient, level-based process.
Multi-Chart Layouts
A layout is a saved arrangement of charts, indicators, drawings, and settings. You can save many and switch between them — an "NQ intraday" layout, a "swing watchlist" layout, a "top-down ladder" layout. Building a few purpose-built layouts and naming them is one of the highest-leverage housekeeping moves on the platform.
Multi-chart puts several charts in one tab (2, 4, 8, or 16 depending on plan). Use it to see multiple timeframes of the same symbol at once, or the same timeframe across correlated tickers (ES, NQ, VIX, DXY side by side for an intermarket read). You can link charts by color group so changing the symbol in one changes them all — priceless for scanning a watchlist across a fixed multi-timeframe view.
Two layouts worth building this weekend
The intermarket dashboard: a four-pane layout with your index, VIX, DXY, and the 10-year yield, all on the daily, unlinked (each holds its own symbol). This is your market weather station — one glance tells you risk-on or risk-off before you touch a single stock. When VIX is spiking, DXY is bid, and yields are ripping, that's not a "buy the dip in a growth name" morning, and this layout tells you that in two seconds.
The top-down ladder: a four-pane layout of one symbol on 1D / 1H / 15m / 5m, all linked by color so typing a new ticker updates all four at once. Now cycling a watchlist is: type ticker, read four timeframes in one screen, next ticker. What used to be sixteen clicks per name is one keystroke. The free plan is 1 chart per tab, which is the big bottleneck here. Plus (4 charts) is where multi-timeframe-in-one-view starts to feel right, and it's the single upgrade that most changes how you work.
Pine Script at a Glance
Pine Script is TradingView's own programming language for building indicators and strategies. You don't need to code to use TradingView — but understanding what Pine is changes how you think about the whole platform, because everything in the community library and every custom HPT tool is written in it.
Open the Pine Editor from the bottom panel. It's a code window where you write a script, hit Add to chart, and your logic plots live on the price data.
Two things Pine does:
- Indicators (studies) — compute and plot values: a custom EMA stack, a session-level tool, an FVG detector, a signal that fires on a candle pattern.
- Strategies — indicators that also simulate buy/sell orders so you can backtest. Run one and the Strategy Tester panel shows net profit, win rate, drawdown, and a trade list on historical data.
Why this matters even if you never write a line
Pine is genuinely learnable — it's readable, well-documented, and the community is huge. It's also where HPT's edge is built: the entire indicator arsenal (tape readers, level tools, EMA framework, delta and POC tools) lives in Pine because the only way to trust a signal is to have written and audited the logic yourself.
You don't have to become a Pine developer to trade well. But knowing that the tool underneath the whole platform is programmable — and that you can read, tweak, and verify any indicator's actual behavior — is what separates a chart-clicker from an analyst. Even a beginner's-level ability to open a community script and read its inputs, spot whether it repaints, and change an EMA length from 21 to 22 to match your framework pays for the hour it takes to learn. And a warning worth its own line: the Strategy Tester's backtest numbers are seductive and often lie. A backtest on default settings, with no commission, no slippage, and unrealistic fills, will show a beautiful equity curve that evaporates live. Treat backtests as hypothesis generators, not proof — set realistic commission and slippage, and always forward-test in Bar Replay before you believe a strategy.
Watchlists & Screeners
A watchlist is your list of tickers, in the right sidebar. Add a symbol, click it to load its chart, organize into sections (indices, sectors, your longs, your shorts). Watchlists sync everywhere and drive the multi-chart linking above. Free plan caps you around 30 symbols in one list; paid tiers open it up. Use the section headers — a watchlist sorted into "Indices / Leading sector / Longs / Shorts / Earnings this week" is a working document; a flat list of 200 tickers is noise.
The Stock Screener (bottom panel) is how you find setups instead of waiting for them. It filters the entire market by criteria you set:
- Technical filters — price above the 200-EMA, RSI oversold, near 52-week high, unusual volume, specific candle patterns.
- Fundamental filters — market cap, P/E, dividend yield, sector, earnings growth.
- Performance filters — % change today/week/month, relative volume.
A concrete screen you can save and run every morning
Say your thesis is "buy strength in the leading sector on a pullback." Build the screen: market cap > $2B (skip the illiquid microcaps), average volume > 1M (you need to get in and out), price above the 200-day EMA (only uptrends), relative volume > 1.5 (something's happening today), and % change from the open in a modest positive band (up, but not already gapped and gone). Save it as "Strong-and-moving." Run it at 9:00 a.m. It might surface twelve names. Sort by relative strength, drop the top five into your linked top-down ladder layout, and now you're reading five real candidates by 9:15 instead of doom-scrolling a chatroom for tips.
You can screen stocks, ETFs, forex, crypto, and more — each has its own screener. This is the tool that operationalizes HPT's macro → sector → stock top-down: use the screener to surface the strongest names in the leading sector, then drop each into the multi-timeframe layout for the real read. The screener finds candidates; the chart makes the decision. Never trade a name straight off a screener hit — a screener has no idea about the wall of resistance three ticks overhead. Set your filters, save the screen, and run it every morning. That's a repeatable edge — a process instead of a hunch.
Bar Replay
Bar Replay (the rewind icon in the top toolbar) is TradingView's time machine, and it's the single best free practice tool the platform has. Click it, click a point on the chart's history, and price rewinds to that moment. Then step forward bar by bar — the future is hidden, and you see the chart exactly as it looked live.
Use it to:
- Practice reading without waiting for live markets — replay a whole day in minutes.
- Backtest a setup manually — find your pattern in history, replay it, and see if your rules actually work.
- Trade on historical data — Replay includes a trading mode (separate from Paper Trading) where you set starting capital and a commission, then place simulated entries and exits as the bars unfold, so you can rehearse the execution, not just the read.
How to run a real Replay practice session
Don't just scrub randomly. Pick a symbol, rewind to a random date you haven't memorized, and put yourself under the same rules you'd trade live: do the top-down read on the higher-timeframe context first (Replay respects your other timeframes), define an entry, a stop, and a 1:3 target, then step the bars forward and let it play out. Keep a tally — twenty reps of a specific setup will teach you more about whether it works than twenty hours of reading about it. One caution: on lower timeframes Replay uses the data granularity available, so intrabar movement is an approximation — don't fool yourself into thinking a replayed 1-minute filled exactly at your wick price. But for building pattern recognition and testing rules, nothing beats it. Rep the read here before you rep it with money.
Placing Your FIRST Stock Trade, Step-by-Step
Now the part the template calls "your first trade" — done the TradingView way, which means through a connected broker, from the chart.
Step 1 — Connect a broker. Open the Trading Panel at the bottom of the chart (there's a "Trading Panel" tab). You'll see a list of supported brokers. Pick yours — Interactive Brokers, tastytrade, OANDA, FOREX.com, AMP Futures, and 100+ others are supported (verify your specific broker is on TradingView's current list; integrations are added and occasionally removed). Click it and log in with your broker credentials in the secure window. TradingView connects to your real, funded broker account — this is not a TradingView balance, it's your broker's.

Step 2 — Confirm you're live, not paper. TradingView also has a built-in Paper Trading account (fake money, no broker needed) in that same broker list — and you should absolutely trade paper first. The panel clearly labels which account is active. Know whether you're on Paper or your real broker before you click buy. Beginners fire real orders thinking they're on paper, and vice versa. Check the account name every single time — make it a physical habit, like checking your mirror before you change lanes.
Step 3 — Load the symbol and do the read. Put your ticker on the chart. Run the top-down: bias from the higher timeframes, trend from the daily EMA stack, structure and level from the intraday. Know your entry, your stop (the price that proves you wrong), and your target — and confirm the setup is at least 1:3 reward-to-risk before you touch the ticket. No read, no trade.
Step 4 — Open the order ticket. Two ways: click Buy/Sell in the Trading Panel, or right-click on the chart at your price → Trade → and set the order there. The chart-based ticket is TradingView's signature move — you can drag your entry, stop, and target lines directly on the price axis.
Step 5 — Fill in the ticket. Set: side (buy/sell), quantity (position size — derived from your stop distance and your risk-per-trade, not a random round number), order type (start with a limit so you control your fill price), and any attached stop and target (a bracket, if your broker supports it).
Step 6 — Review and send. Check side, size, price, and order type one more time. Send. The order routes to your broker; TradingView shows the working order and, once filled, your position and P&L in the panel — plotted right on the chart.
Step 7 — Manage from the chart. Drag your stop or target line to modify, or close the position from the panel. Your risk lines live on the chart where you can see them against price the whole time.
A fully worked first trade
You're long a stock at $50.00. Your read says the trade is wrong below the prior swing low at $49.00 — that's your stop, $1.00 of risk. You risk $100 per trade by rule, so your size is 100 shares ($100 ÷ $1.00). Your target is the prior high at $53.00 — that's $3.00 of reward against $1.00 of risk, a clean 1:3. On the ticket you set a limit buy at $50.00 for 100 shares, with a bracket: stop at $49.00, target at $53.00. You send it. Because it's a bracket, the moment your target fills the stop auto-cancels, and vice versa — the trade manages itself and you don't have to babysit it or fight the urge to move the stop. That's the entire payoff of the platform: you analyze and execute in the same window, on the same chart, with your risk drawn on the price, and the math done before you clicked. No switching to a separate broker app and losing the read.
Options: Approval & the Options Chain Here
This section needs the honest framing, because it's where beginners most expect TradingView to be something it isn't.
TradingView does not grant options approval — your broker does. Options approval is a regulated process: you apply at your broker (tastytrade, IBKR, etc.), answer questions about your experience, income, and objectives, and get assigned an approval level (roughly: Level 1 covered calls/cash-secured puts, Level 2 long calls/puts, Level 3 spreads, higher levels for naked/complex strategies — exact tiers and names vary by broker). TradingView has no say in it. If your connected broker approves you for options, you trade them through that integration; if it doesn't support options via TradingView, you place them in the broker's own platform.
The options chain in TradingView. TradingView has been expanding options data and an options chain view (verify current availability for your symbol and plan — this is an actively changing area). Where available, you can pull up the chain to see strikes, expirations, bid/ask, volume, open interest, and implied volatility. It's improving, but be straight with yourself: for deep options analytics — full Greeks, complex multi-leg spread building, options-specific risk graphs — dedicated broker platforms still lead. TradingView is a charting-first tool that's adding options, not an options-first platform.
How to read the chain, wherever you read it
The strike is your chosen price; the expiration is your time; the bid/ask is what you buy and sell for (mind the spread — wide spreads bleed you); open interest and volume show liquidity (trade liquid strikes); implied volatility tells you how expensive the option is relative to expected movement. For HPT's purposes, options positioning — call walls, put walls, gamma flip — is usually read off a dedicated GEX terminal and then mapped onto the TradingView chart as horizontal levels. The chart is where you see price relative to those walls: a big call wall overhead is a magnet-and-ceiling; a put wall below is a floor. You draw those as levels in TradingView and trade the price action into them — the chart doesn't compute the gamma, but it's where the gamma becomes actionable.
The Order Ticket & Order Types
Here's the important nuance: the order types available depend on your connected broker, not on TradingView. TradingView presents the ticket; the broker defines what it accepts. So the exact menu varies — but the common types you'll see across most integrations:
- Market — fill immediately at the best available price. Fast, but you don't control the price; on illiquid names or fast tape you can get a bad fill. Use sparingly.
- Limit — fill only at your price or better. You control the price, but you might not get filled. The beginner's default.
- Stop (stop-market) — becomes a market order when price hits your stop level. Your protective exit. Guarantees execution, not price.
- Stop-Limit — becomes a limit order at your stop. Controls price but risks not filling in a fast move — dangerous for a protective stop in a gap.
- Bracket / OCO (one-cancels-other) — an entry with an attached stop and target; when one exit fills, the other cancels. This is how you enforce your 1:3 automatically. Support depends on the broker.
- Trailing Stop — a stop that follows price by a set distance to lock in gains. Broker-dependent.
When to reach for which
Use a limit to enter — you're patient, you have a price, let the market come to you. Use a stop-market to protect — when you're wrong you want out, guaranteed, and you'll accept whatever price the exit gets rather than risk a stop-limit not filling as price gaps through it. That last point trips people up constantly: a stop-limit on your protective exit can leave you holding a losing position in a fast drop because price blew past your limit without filling. For the one job of "get me out when I'm wrong," accept the market fill. TradingView's edge on the ticket is visual, chart-based order entry — dragging entry/stop/target lines on the price axis instead of typing numbers into boxes. It makes risk tangible; you see how far your stop is from your entry, and a 1:3 either looks right or it doesn't. But always confirm which types your specific broker actually supports through the integration; the list above is typical, not guaranteed.
Fees, Commissions & Payment-for-Order-Flow Reality
There are two separate cost stacks here, and conflating them is a classic beginner error.
Stack 1 — Your TradingView subscription. This is the charting cost: Basic (free), Essential (~$14.95/mo), Plus (~$29.95/mo), Premium (~$59.95/mo), Ultimate (~$199.95/mo annual) — verify current pricing, and note annual billing is meaningfully cheaper than monthly. This buys you charts, indicators, alerts, and history. It has nothing to do with your trading commissions. You pay it whether you place a trade or not. Add real-time data fees on top if you need live exchange data for certain markets (some feeds are delayed or extra-cost; verify per exchange).
Stack 2 — Your broker's trading costs. Commissions, spreads, options contract fees, futures fees, margin interest — all set by your broker, not TradingView. Trade through IBKR and you pay IBKR's schedule; through tastytrade, theirs. TradingView just routes the order.
Payment for order flow, the honest version
PFOF is when a broker sells your order to a market maker who executes it, and pays the broker for the flow. "Commission-free" brokers often make money this way. It's not inherently evil, but it creates a conflict of interest and can mean slightly worse fill prices than you'd get elsewhere. This is a broker-level reality, not a TradingView one — TradingView doesn't take PFOF; it's a charting company. But since you're routing real orders through a broker from the chart, the PFOF and execution-quality question follows your broker choice. Pick your broker on execution quality and fee transparency, not just on whether it says "free." Free is never free; you're paying somewhere, usually in the spread. For an active trader placing many orders, a fraction of a cent of worse fill per share compounds into real money — sometimes more than the "commission" you saved.
Margin, Account Types & PDT on This Platform
Same principle, and by now you can guess it: these are broker-account attributes, not TradingView attributes. TradingView is charting software — it has no account types, no margin, no regulatory status. It displays your broker's account and buying power once connected.
- Account types — cash vs. margin, individual vs. joint vs. IRA, etc. — are chosen and defined at your broker. TradingView just shows whichever account you connected.
- Margin — borrowing buying power against your account — is a broker feature governed by broker terms and regulation (Reg T, maintenance requirements). Your margin, your interest rate, and your maintenance calls all live at the broker. TradingView reflects the buying power the broker reports.
- PDT — the Pattern Day Trader rule — is a U.S. regulatory rule (FINRA), enforced by your broker, not by TradingView. It flags accounts that make 4+ day trades in 5 business days in a margin account under $25,000 and restricts further day trading until the balance is met. TradingView can't trigger or exempt you from PDT — only your broker account status and balance do. If you're trading a small U.S. margin account through a connected broker, the PDT rule applies exactly as it would in the broker's own platform. (Futures and some non-U.S. accounts aren't subject to PDT — one more reason to know your broker and account type cold.)
The lesson across all three: TradingView is the cockpit; the regulatory and money reality lives in the broker. Never assume a TradingView setting changed your account rules — it didn't. Verify at the broker, every time.
How It Behaves in Different Market Regimes
The chart is the same chart in every market, but how you read it has to bend to the regime — and knowing which regime you're in is half the skill. Beginners run one playbook into every condition and wonder why the tool "stopped working." The tool didn't change; the market did.
Trending regime
Price is making clean higher highs and higher lows (or the reverse), the EMA 12/22/55 stack is fanned and sloping, and pullbacks are shallow. Here the chart is at its most generous: your EMAs and VWAP act as dynamic support/resistance, the golden pocket on each pullback is a genuine entry, and trend-following indicators sing. Lean into pullback entries, hold for the trend's continuation, and give winners room. The mistake in a trend is fading it — shorting into a rip because "it's extended." Extended gets more extended. Let the higher-timeframe bias carry you.
Chop / ranging regime
Price is oscillating between a defined high and low, the EMAs are flat and tangled, and breakouts keep failing back into the range. Here trend tools whipsaw — a MACD cross means little, an EMA cross fires and immediately reverses. Switch playbooks: trade the edges of the range, fade the extremes back toward the middle, and respect the range high and low as the levels that matter. Oscillators like RSI (overbought at the top, oversold at the bottom) come into their own. The mistake in chop is trading the middle and chasing every fakeout breakout. If the market is ranging, either trade the boundaries or stand aside — and a Renko or Line Break chart type can strip out the time-noise and make the range structure obvious.
High-volatility regime
News-driven, gappy, VIX elevated, candles two and three times their normal size. Here your stops need to be wider or your size smaller — usually both. A stop that's fine in a calm tape gets picked off by noise in a volatile one. Position size comes down so that a wider stop still only risks your fixed dollar amount. Market orders get dangerous (spreads widen, fills slip), so limits matter more, and the chart's ATR or Bollinger Band width will show you the volatility expansion at a glance. The mistake in high vol is trading your normal size with your normal stop and getting stopped out of a correct read by sheer noise, or getting a horrific market fill. Respect the regime: smaller, wider, more patient.
The through-line: read the regime first, then pick the playbook. TradingView gives you every tool for every regime — your job is to know which tools are lying to you right now.
Combining TradingView With Other Tools (Confluence)
The chart is strongest when it's not read alone. Three combinations do most of the heavy lifting in the HPT process.
With a GEX / options-positioning terminal
Options dealers' gamma exposure creates real magnets and walls in price. You read the call walls, put walls, and gamma flip off a dedicated GEX terminal, then draw them as horizontal levels on your TradingView chart. Now your chart read and your positioning read are on the same screen: price approaching a big call wall from below into a bullish trend is a "ride to the wall, expect a stall" trade; price losing the gamma-flip level is a "volatility about to expand" warning. The chart provides the price action into the level; the terminal provides why the level exists. Neither is complete without the other.
With intermarket context (ES / NQ / VIX / DXY / yields)
No stock trades in a vacuum. Your intermarket dashboard layout answers the question the single chart can't: is the whole market supporting this trade? A beautiful long setup in a growth name is a very different trade when VIX is collapsing and yields are falling (tailwind) versus when VIX is spiking and the dollar is ripping (headwind straight into your face). Read the environment first, the single name second. The chart engine makes this trivial — same tools, four panels, one glance.
With the news and the economic calendar
TradingView's built-in news feed and economic calendar (right sidebar) fold the catalyst into the technical read. A gorgeous technical short set up thirty minutes before a Fed decision is not a trade — it's a coin flip you've dressed up as analysis. The calendar tells you when to stand aside; the news feed tells you why the tape is doing what it's doing right now. Weave the catalyst into the read: the chart shows you the what, the news tells you the why, and the two together are a thesis instead of a guess.
How the Pros Use It Differently From Beginners
The same software, in two very different pairs of hands. The gap is almost never about features — it's about process.
- Beginners add indicators; pros remove them. A beginner's chart has nine indicators fighting for attention. A pro runs three or four that they understand cold and reads price first, indicators second. The indicator confirms the read; it doesn't make it.
- Beginners start on the 1-minute; pros start on the monthly. The novice finds a pretty low-timeframe pattern and hunts for justification. The pro establishes higher-timeframe bias first and only drops to the 1m to time a trade the higher timeframes already permitted.
- Beginners trade the screener hit; pros trade the chart. A screen result is a candidate, not a setup. The pro drops it into a top-down layout and lets the chart veto plenty of screener hits that were sitting under a wall.
- Beginners trust community scripts; pros verify or build them. The novice trades a five-star indicator's signals blind. The pro tests it in Bar Replay for repainting, or writes their own so they know exactly what fires it.
- Beginners set forty alerts; pros set five. Alert discipline mirrors trade discipline — you alert on decisions, not on noise.
- Beginners chase; pros wait for the level. With key levels drawn and alerts set, the pro lets price come to a pre-decided zone. The novice buys because it's "going up right now."
- Beginners move the stop; pros bracket it and walk away. The pro's exits are automatic the moment the trade goes on. The novice negotiates with a losing position in real time and turns a 1:3 into a 3:1 against them.
The uncomfortable truth: the platform doesn't make you a pro. The process you run through it does. The pros' charts are usually simpler, not fancier.
Common Mistakes on TradingView
- Thinking it's a broker. Trying to "fund TradingView" or expecting it to hold your money. It doesn't. Fund your broker. This one misconception causes a cascade of confusion about margin, PDT, and fees — clear it first.
- Confusing Paper and live accounts. Firing real orders thinking it's paper, or clicking hesitantly through a paper account thinking real money is on the line. Check the account label on the Trading Panel every time, as a physical habit.
- Trusting the public library blindly. Adding a five-star community indicator and trading its signals without testing for repainting. Verify in Bar Replay first, every single time, before a script earns a place on your chart.
- Fighting the free-plan limits instead of trading around them. Trying to run a six-indicator confluence read on a two-indicator free plan and wondering why it feels broken. Either upgrade or simplify to the two indicators that carry the read.
- Ignoring data fees / delayed data. Trading off a delayed feed and not realizing your prices are fifteen minutes stale. Confirm your data is real-time for what you actually trade — the little clock or "D" icon by the symbol tells you.
- Over-drawing the chart. Fifteen trendlines, forty levels, three oscillators screaming — analysis paralysis rendered in pixels. Clean chart, the handful of levels that matter, one clear invalidation. If you can't say your thesis in a sentence, your chart has too much on it.
- Market orders on illiquid names. Getting a terrible fill because you didn't use a limit into a wide spread. Limit to enter, always, unless you have a specific reason not to.
- Stop-limit on the protective exit. Using a stop-limit to protect a position and getting left holding a loser when price gaps through the limit. Use a stop-market for the one job of getting out when you're wrong.
- Skipping the read and clicking Buy off the ticket. The chart-based ticket is so smooth it tempts impulse trades. The ticket is the last step, not the first. No read, no trade.
- Running one playbook into every regime. Trend-following into chop, fading into a rip. Read the regime before you pick the tools.
- Trading through the catalyst. Putting on a technical trade thirty seconds before a scheduled news event the calendar plainly showed you. Let the calendar tell you when to stand aside.
- Not sizing off the stop. Picking a round-number share count instead of deriving size from stop distance and fixed dollar risk. Size is an output of your stop, not a gut number.
Notice how many of these are discipline problems dressed up as software problems. That's the whole HPT point: the tool is only as good as the process you run through it.
Strengths & Weaknesses vs Peers
Strengths:
- The best charts, full stop. Cleanest engine, most fluid drawing, best cross-asset consistency.
- The public library + Pine Script. Nothing else has this breadth of community indicators plus a real, learnable scripting language.
- Broker-agnostic. Analyze once, route to any of 100+ brokers. You're not trapped in one broker's platform, and you can switch brokers without relearning your charts.
- Alerts, screeners, replay, multi-chart — a complete analysis workflow in one place.
- Everyone uses it. Shared language with the rest of the market; ideas, layouts, and scripts are portable.
Weaknesses:
- Not a broker. Requires a connected broker (or its paper account) to trade — extra setup, and the trading feature set depends on that broker.
- Options depth lags dedicated platforms like thinkorswim (Greeks, complex spreads, options risk graphs).
- Real cost stacks up — subscription plus possible data fees plus broker costs.
- Free plan is genuinely tight — 2 indicators, 1 chart, minimal alerts, and ads.
- Public library quality varies wildly — repainting scripts are everywhere.
Versus peers: thinkorswim wins on options and being a true all-in-one broker; NinjaTrader wins for dedicated futures execution; broker-native platforms win on integrated everything. But for pure charting, multi-asset flexibility, and analysis workflow, TradingView is the default the rest are measured against. Most serious traders analyze in TradingView regardless of where they execute — which tells you everything about where its real strength lies.
How HPT Uses It for the Top-Down Read
Everything above is capability. Here's how it becomes a method — Hollow Point's macro → sector → stock top-down, executed entirely on this engine:
- Macro & sector first, in a multi-chart layout. Indices, VIX, DXY, yields, sector leaders linked in one tab. Where's the market's bias, and which sector is leading? That's the weather before any single stock.
- Screen for the strongest names in the leading sector — technical + relative-strength filters. The screener finds candidates; it doesn't make the call.
- Run the timeframe ladder on each candidate — 1m through 3MO. Monthly for bias, daily 55-EMA for the trend tell, hourlies for structure, 5m/1m for the trigger. Same chart, same tools, all the way down.
- Mark it up — levels, the EMA 12/22/55 stack, VWAP, volume, RSI/MACD, Fibs with the golden pocket, and the specific price that invalidates the read.
- Weight the confluence across timeframes, fold in options positioning (walls mapped onto the chart) and the day's news. Timeframes agree or they don't — and you say which.
- Only then, the ticket. Entry, stop, target, minimum 1:3 reward-to-risk, position sized off the stop. Bracket it so the exits are automatic. Route to the broker from the chart.
- Manage from the chart, risk lines drawn on price, and let the rules — not the emotion, not the P&L blinking at you — run the trade.
TradingView is the room where all of that happens. Not because it fills the order — the broker does that — but because it's where the reading happens, and the reading is the whole job. The platform gives you the cockpit. The discipline is what flies the plane.
FAQ
Do I need to pay for TradingView to trade? No. The free Basic plan charts, draws, and even connects to a broker's paper account. You'll upgrade when the two-indicator and one-chart limits start choking a real confluence read — not before.
Is my money safe in TradingView? There's no money in TradingView to be safe. It never holds funds. Your cash lives at your broker, protected by whatever regulatory scheme covers that broker (SIPC in the U.S. for securities, etc.). TradingView is a subscription, not a custodian.
Can I trade futures / forex / crypto from the chart too? Yes, wherever you've connected a broker that supports that asset. The chart engine is identical across assets; only the connected broker and the available order types differ.
Why do my prices look delayed? Free and some lower tiers show delayed data for certain exchanges. Look for the delay indicator by the symbol. If you're trading intraday, buy the real-time data feed for the exchanges you trade — a delayed feed is a way to lose money you can't see.
What's the difference between Paper Trading and Bar Replay's trading mode? Paper Trading simulates orders on live current data with fake money — practice in real time. Bar Replay's trading mode simulates orders on historical data as you step the bars — practice on the past, at your own pace. Use Replay to build pattern recognition, Paper to rehearse in live conditions.
Will TradingView protect me from the PDT rule or a bad margin call? No. Those live entirely at your broker. TradingView only displays what the broker reports. Manage them at the broker.
Are the community indicators safe to trade? Treat every one as guilty until proven innocent. Test for repainting in Bar Replay, prefer open-source scripts you can read, and never trade a signal you don't understand the trigger for.
Should I trust the Strategy Tester backtest? Only as a hypothesis. Add realistic commission and slippage, and forward-test in Bar Replay before believing any equity curve. Default-setting backtests flatter every strategy.
How many indicators should I actually run? Fewer than you think. Three or four you understand cold beat nine you half-read. The EMA stack and VWAP carry most intraday reads on their own.
Quick-Reference Cheat-Sheet
The mental model
- TradingView = cockpit (analysis). Broker = engine (money, orders, margin, PDT, options approval). Wire them together; never confuse them.
Setup order
- Free TradingView account → learn the interface.
- Build two layouts: intermarket dashboard + linked top-down ladder.
- Put EMA 12/22/55 + VWAP + volume on the daily.
- Rep Bar Replay for hours before risking a dollar.
- Connect the broker's paper account → rehearse the ticket.
- Go live small, sized off the stop, bracketed.
The interval box — type 15, 1D, 4H and Enter; don't open the dropdown. Change symbol — click the ticker, start typing. Key hotkeys — Alt+H horizontal, Alt+T trend line, Alt+F Fib, comma/period to step Replay.
Order types, plain
- Enter with a limit (control your price).
- Protect with a stop-market (guarantee the exit).
- Enforce 1:3 with a bracket / OCO (exits automatic).
- Avoid market on illiquid names and stop-limit on protective exits.
Regime playbook
- Trend: EMAs/VWAP as support, buy pullbacks (golden pocket), don't fade.
- Chop: trade the range edges, respect RSI extremes, don't chase breakouts.
- High vol: size down, stops wider, limits not markets, watch ATR/BB width.
Plan limits that bite
- Free: 2 indicators, 1 chart, 3 price alerts, 0 technical alerts, ads.
- Upgrade trigger: when confluence needs 3+ indicators or you want technical alerts and multi-chart.
Before every trade — the checklist
- Higher-timeframe bias established? (monthly/daily)
- Trend confirmed on the daily 55-EMA?
- Level and structure marked on the intraday?
- Entry, stop (the price that proves you wrong), target defined?
- At least 1:3 reward-to-risk?
- Size derived from the stop, not a round number?
- Regime read and catalyst calendar checked?
- Paper or live confirmed on the panel?
- Bracket set so exits are automatic?
The one rule that survives everything
- The platform gives you the cockpit; the discipline flies the plane. No read, no trade.
Set it up this weekend. Free account, one clean layout, the EMA framework on the daily, Bar Replay for a few hours of reps. Then next week, connect the paper account and rehearse the ticket. Build the process before you build the position.
Bound by rules, feared by trade.