
The first time you open an options chain, it looks like a spreadsheet designed to intimidate you. Rows of strikes stacked like a ladder, two mirrored halves for calls and puts, and a dozen columns of numbers that all seem to update at once, flickering green and red every second. Most new traders react one of two ways: they freeze, or they click the cheapest-looking number and hope. Both are how accounts die.
Here's the reframe that changes everything. The options chain is not a menu you order from. It's a cockpit. Every column is an instrument telling you something specific — where the market thinks price is going, how fast, how expensive that opinion is, and where the crowd has already placed its bets. Learn to read the instruments and the chain stops being noise. It becomes the richest real-time map of market expectation you'll ever look at — and it's free, sitting inside every broker you already have.
Think about what that actually means. The chain is not one person's opinion. It's the aggregate of every hedge fund, market maker, dealer desk, and retail trader who has put real capital behind a view — distilled into numbers that update tick by tick. When you learn to read it, you're reading a live transcript of what the market thinks. That is a genuine edge, and almost nobody uses it because almost nobody bothers to learn which gauge is which.
This is the one skill that sits underneath every options strategy. You cannot run a covered call, a vertical spread, a cash-secured put, a calendar, an iron condor, or a plain directional swing until you can read the chain that prices them — every strategy is just a specific way of buying or selling specific cells in this grid. So we're going to take it apart column by column, rebuild it, and then — the part nobody teaches — walk through how you actually pick a strike and expiration from a live chain when you have a real thesis. HPT-style: top-down, rules first, ego last.
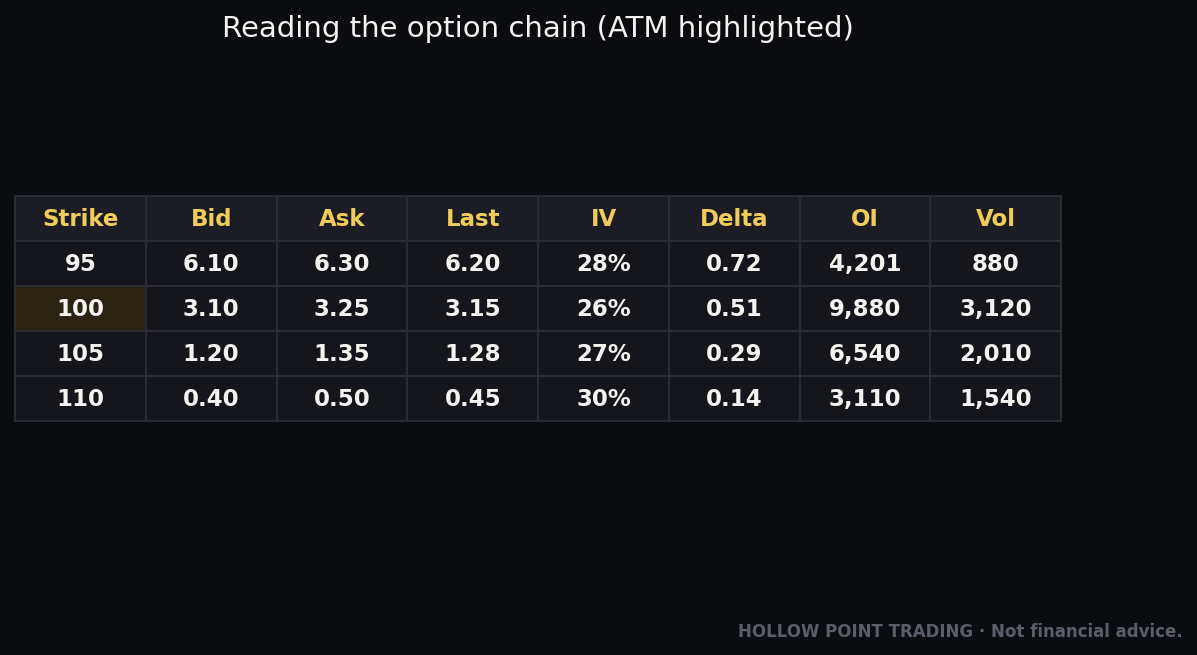
The Concept: What an Options Chain Actually Is
An options chain is the complete list of every option contract available for one underlying — one stock, ETF, or index — organized by two axes: expiration date and strike price. That's it. Two dimensions. Once you internalize that the entire wall of numbers is just "every contract, sorted by when it dies and at what price it converts," the intimidation drops by half.
The atom: what one contract actually is
Let's define the atom first. An option contract is the right — not the obligation — to buy or sell 100 shares of the underlying at a fixed price, on or before a fixed date. A call gives you the right to buy at the strike. A put gives you the right to sell at the strike. You pay a premium for that right. The person on the other side collects the premium and takes on the obligation.
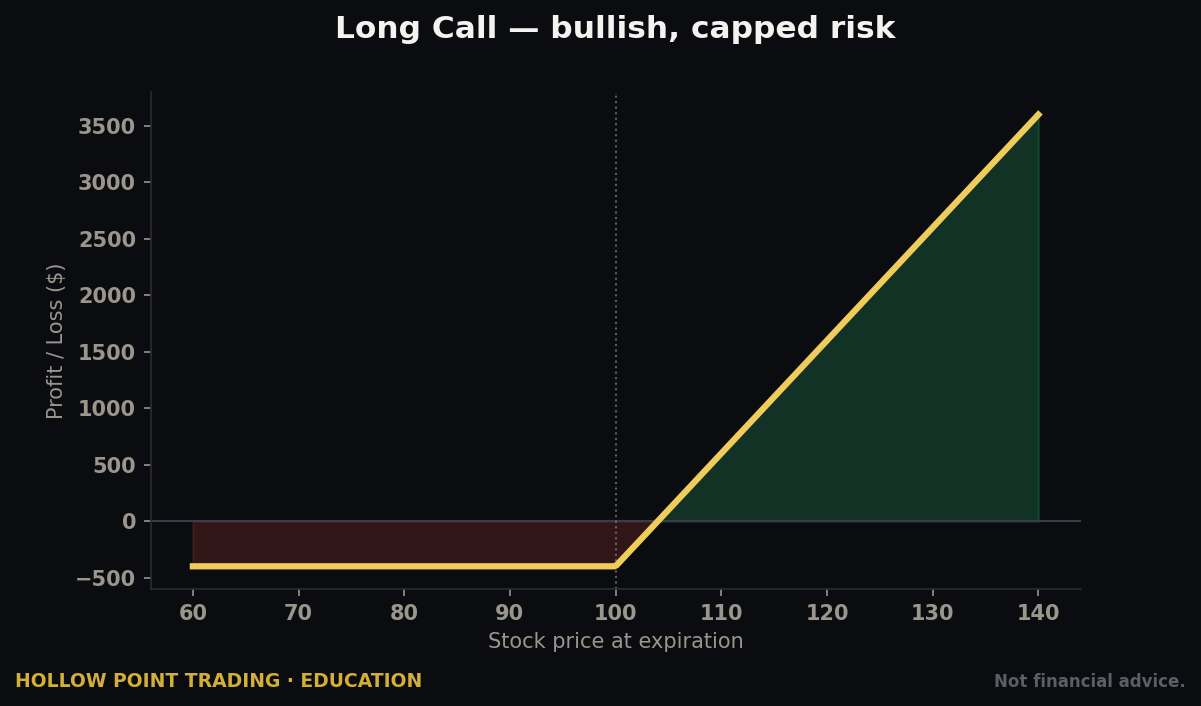
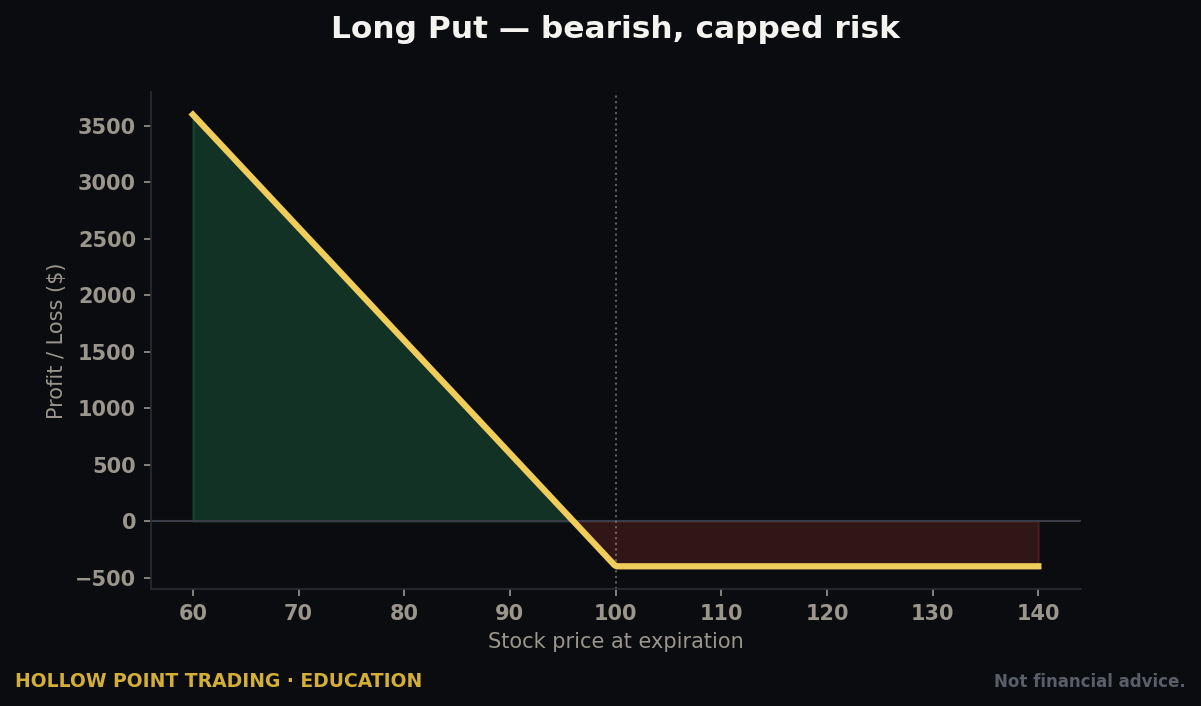
That word "obligation" is where the whole risk asymmetry lives. When you buy an option, the most you can lose is the premium — risk capped, reward open. When you sell one, you collect a small premium up front but take on an obligation that can cost far more than you received. That's why buyers and sellers read the chain with different eyes: the buyer shops for cheap convexity (small cost, big potential payoff), the seller for rich premium (a fat cushion for the risk absorbed). The same grid serves both, and reading it well starts with knowing which side you're on.
Also burn one number in: the multiplier is 100. Every quoted premium is per share, but a contract controls 100 shares. A call quoted at 2.10 costs $210, and a $1 move against your 0.50-delta call moves your position $50, not 50 cents. New traders misjudge size by two orders of magnitude reading the per-share number and forgetting the ×100. The chain quotes small; the risk is large.
The two axes
Two words define every contract and they are the two axes of the chain:
- Strike price — the fixed price at which the option converts to stock. A 150 call lets you buy the stock at $150 no matter where it's trading.
- Expiration date — the day the right expires. After it, the contract is either exercised or worthless.
The chain takes those two variables and builds a grid. Down the middle runs a column of strikes — 140, 145, 150, 155, 160 — like rungs on a ladder. To the left of the strikes sit the calls. To the right sit the puts (this is the near-universal convention; a few platforms let you stack them, but calls-left/puts-right is the default you'll see 95% of the time). Across the top, tabs or dropdowns let you flip between expiration dates: this Friday, next Friday, the monthly, the one three months out, the LEAPS a year out.
Every cell where a strike row meets a data column tells you something about that one specific contract. The 150 call expiring this Friday has its own price, its own volume, its own implied volatility, its own Greeks — completely separate from the 150 call expiring next month, and from the 155 call expiring this Friday. Each contract is its own tiny market with its own buyers and sellers, its own liquidity, its own supply and demand. There is no single "the option" for a stock. There are hundreds, and they behave differently.
Why the grid exists at all
So when someone says "read the chain," they mean: scan this grid and extract what the market is collectively pricing. Where's the money positioned? How expensive is fear right now? Which strikes are liquid enough to trade? What's the probability baked into each level? All of it is sitting in the grid. You just need to know which instrument is which.
Here's a mental model that helps: think of the chain as a probability distribution laid on its side. The strikes are outcomes; the prices and IVs encode how likely each is and what the market will pay to bet on it. The ATM strike sits at the peak — the most likely landing zone. The far wings are the tails — cheap because they're improbable. That's why the chain is richer than a chart alone: a chart shows where price has been, the chain shows where the crowd is betting it will go, and how confident they are.
The Mechanism: Every Column, Decoded
Let's walk the columns left to right as they typically appear, and define each one exactly once. This is the reference section — the part you'll come back to and re-read until it's automatic.
Strikes: the spine of the chain
The strike column runs vertically down the center. Strikes are spaced at fixed intervals — often $1, $2.50, $5, or $10 apart depending on the stock's price and liquidity. A $30 stock might have strikes every dollar. A $600 stock like SPY has them every dollar too because it's ultra-liquid, but a thinly traded $600 stock might only offer $10 increments. The tighter the strike spacing, the more precisely you can target a level — and tight spacing is itself a liquidity tell, because exchanges only list dense strikes on names that trade enough to justify them.
The strikes are anchored by where the stock is trading right now, the spot price. That anchor point splits the whole chain into three zones, and platforms shade them so you can see the split instantly.
ITM, ATM, OTM: the shading that orients you
- ITM — In The Money. The option already has intrinsic value. For a call, that's any strike below spot (you have the right to buy cheaper than market). For a put, any strike above spot. If the stock is at $152, the 150 call is $2 in the money; the 155 put is $3 in the money.
- ATM — At The Money. The strike closest to spot. At $152, the 150 or 152.5 strike is your ATM. This is the pivot of the whole chain — maximum time value, maximum gamma, the most active strike.
- OTM — Out of The Money. No intrinsic value, only time value / hope. Calls above spot, puts below. The 160 call and the 145 put when the stock is $152 are both OTM.
Here's the piece that makes this useful instead of just vocabulary: an option's price is always intrinsic value plus extrinsic value. Intrinsic is the "already in the money" part — a 150 call with the stock at $152 has $2 of guaranteed intrinsic. Extrinsic (time value) is everything above that: the premium for the possibility of more movement before expiration. An OTM option is pure extrinsic — 100% hope — which is why it decays to zero if the stock doesn't move; there's nothing underneath. A deep-ITM option is mostly intrinsic and barely decays. When you pick a strike, you're choosing your mix of "guaranteed value" versus "leverage on hope." That one idea explains most of what beginners get wrong.
Brokers shade the ITM side — usually a tinted background running down the call column below spot and up the put column above spot — so the ITM/OTM boundary is visible at a glance. The place where the shading flips is the at-the-money line. Find that line first, every time you open a chain. It orients you the way finding "you are here" orients you on a map. Everything else — which strikes are cheap, which are liquid, where the walls are — reads off that anchor.
Bid, Ask, Last, Mark, and the spread
These are the price columns, and confusing them is the number-one beginner error.
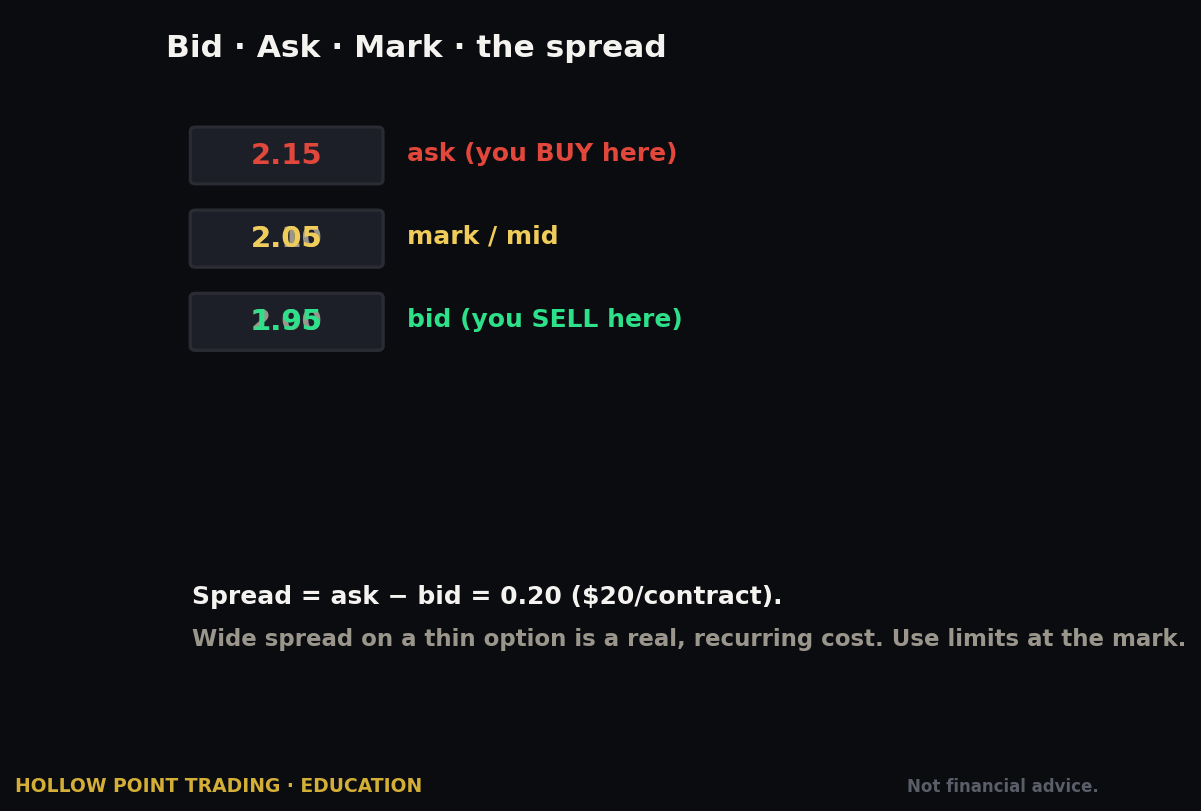
- Bid — the highest price a buyer is currently willing to pay. If you want to sell your contract right now, this is what you get.
- Ask (or Offer) — the lowest price a seller will accept. If you want to buy right now, this is what you pay.
- Last — the price of the most recent actual trade. It can be stale — from an hour ago on an illiquid strike — which makes it dangerous to anchor on.
- Mark — the midpoint between bid and ask,
(bid + ask) / 2. This is the fair estimate of the contract's value and what your platform uses for P&L. It's what you should mentally price from.
The spread is the gap between bid and ask. On SPY's ATM weekly, that gap might be one cent — bid 3.20, ask 3.21. On some illiquid small-cap's monthly, it might be bid 1.10, ask 1.60 — a fifty-cent spread, which is a 31% tax you pay just to get in and out. The spread is the single fastest liquidity read on the chain. Tight spread = liquid, easy to trade, fair fills. Wide spread = illiquid, you'll get skinned on entry and exit, avoid unless you have a very good reason.
Here's the math that should make you flinch. Buy that illiquid option at the ask of 1.60 and the moment you're filled the mark is still 1.35 (the midpoint) — you're down 25 cents, ~18% of your position, before the stock has moved a tick. The stock rises, the mark climbs to 1.50, and you're still red because you overpaid on entry — and to exit you sell at the bid, lower again. The spread taxes you twice: once in, once out. On a tight SPY contract that round-trip is a penny or two; on a wide-spread name it can be a third of your capital. It's the most underrated cost in options trading and the easiest to avoid — just look at the spread before you click.
Rule of thumb: never pay the ask blindly. Work your order at the mark or a cent or two toward the ask, and let it sit. On liquid names you'll usually get filled at or near the mark within seconds. On a wide spread, the mark is your anchor and the ask is a robbery — and honestly, on a truly wide spread the right move is usually not to trade at all.
Volume vs Open Interest: today's traffic vs the standing crowd
These two get conflated constantly. They measure different things.
- Volume — the number of contracts traded today, at this strike, this expiration. It resets to zero every morning. It tells you where today's action is.
- Open Interest (OI) — the total number of contracts currently open and outstanding at this strike — positions that have been opened and not yet closed. It's the standing crowd. It only updates once per day (usually overnight), so intraday it's a snapshot from this morning.
An analogy: volume is the cars that drove past a spot today; open interest is the cars parked there. Huge volume with tiny OI = lots of traffic, nobody staying — positions opened and closed the same day (0DTE churn). Low volume with huge OI = a full parking lot nobody touched today — a big standing position built earlier. Both tell you something different about who's involved and why.
Volume is the flow; OI is the pool. High volume with low OI means fresh positioning is happening right now — someone's building or dumping a position today. High OI means a lot of money is already parked at that strike, which matters enormously for support/resistance and for options-driven price magnets. When you see a strike with 40,000 open interest while its neighbors have 2,000, that strike is a wall — a level where dealers and traders have massive exposure, and price often gravitates toward or stalls at it near expiration.
For trade selection, both matter for a simpler reason: liquidity. A strike with healthy volume and OI will have a tight spread and easy fills. A strike with single-digit volume and near-zero OI will have a wide spread and you'll be trading against a market maker who knows you're stuck. A quick working rule: for a strike you intend to actively trade, you'd like to see OI in at least the high hundreds to thousands and same-day volume that isn't a rounding error. Below that, assume you'll pay a spread tax and struggle to exit in a hurry.
Implied Volatility (IV): the price of expectation
Implied volatility is the market's forecast of how much the underlying will move, annualized, expressed as a percentage — and it's derived from the option's price, not the other way around. When traders bid options up, IV rises. When they sell them down, IV falls. IV is fear and demand made numeric.
Here's the critical mental model: IV is the price of the option in probability terms. A high-IV option is expensive — the market is pricing in a big move, so you're paying up for that move to actually happen. A low-IV option is cheap. Two options can look identically priced in dollars but one is a bargain and one is a rip-off depending on IV relative to what the stock actually tends to do (its historical/realized volatility) and where its own IV usually sits (IV rank / IV percentile).
There's a rough shortcut worth knowing: IV converts to an expected move. An annualized IV of ~16% implies roughly a 1% expected daily move (16% ÷ √252 ≈ 1%), so a name at 32% IV is priced to move about twice as much per day as one at 16%. Better still, the market hands you the expected move directly: the ATM straddle price (ATM call plus ATM put) for an expiration is, in round numbers, the move priced into that window. If the weekly ATM straddle costs $6, the market is saying "roughly ±$6 by Friday." That one number reframes every strike choice — you instantly see whether the strike you're eyeing is inside or outside the move the chain itself predicts.
IV rank and IV percentile: high or low compared to what?
An IV of 45% means nothing in isolation. Forty-five percent is dirt cheap for a biotech that routinely runs at 90%, and sky-high for a utility that lives at 15%. That's why the two numbers that actually matter are IV rank and IV percentile — both of which compare current IV to that same stock's own IV history over the past year.
- IV rank measures where current IV sits between its 1-year low and high. If IV ranged from 20% to 80% this year and today it's 50%, IV rank is 50 — right in the middle. If today it's 74%, IV rank is (74−20)/(80−20) = 90 — near the top of its range.
- IV percentile measures what fraction of days over the past year IV was lower than today. An IV percentile of 85 means IV has been lower than this on 85% of days — it's historically elevated.
Why this rules the whole trade: high IV rank favors selling premium, low IV rank favors buying it. When IV rank is high, options are expensive relative to this stock's norm, so you lean toward being a net seller (spreads, cash-secured puts, covered calls) and let the inevitable "mean reversion" of IV work for you. When IV rank is low, options are cheap, so long calls and puts are more forgiving and you lean toward being a net buyer. You check IV rank before you even think about direction. It decides whether you're structurally a buyer or a seller. Direction only decides which buyer or seller.
IV crush: the trap the chain warns you about
Why you cannot ignore IV: you can be right on direction and still lose. Buy a call before earnings when IV is jacked to 90%, the stock pops 3% on the report, and your call loses money because IV collapses from 90% to 45% the instant the news is out. That collapse is IV crush, and it's the graveyard of new traders who buy options into earnings.
Here's why it happens mechanically. Before a known event — earnings, an FDA decision, a Fed meeting — the market knows a big move is possible, so it bids up every option's extrinsic value and IV inflates. That inflated premium is the market charging you for the uncertainty. The moment the event passes, the uncertainty is resolved — good news, bad, or a shrug — and all the extrinsic value that was pricing "we don't know yet" evaporates in seconds. The stock can move exactly the amount priced in and your long option still bleeds out, because the uncertainty premium you paid for no longer exists. The chain warned you — the IV column was screaming, and the pre- versus post-event IV gap was visible days in advance — you just didn't read it. The disciplined move into a known catalyst is either to sell that inflated premium, to structure the trade so you're not net-long vega, or to simply wait for the crush and trade the cleaner aftermath.
The volatility skew: reading IV across strikes
Now scan the IV column down the strikes instead of at one strike. You'll notice IV isn't flat. On most equities and indices, OTM puts carry higher IV than OTM calls. That asymmetry is the volatility skew (sometimes "smirk"). It exists because markets crash down faster than they melt up — everyone wants downside protection, so puts stay bid, so their IV is structurally higher.
The skew is a sentiment instrument. A steepening put skew means the market is paying up for crash protection — nervousness rising. On some names — meme stocks, biotech pre-catalyst, commodities — you'll see the opposite, a call skew, where OTM calls are bid up because everyone's chasing upside. Reading the shape of IV across the chain tells you which direction the fear is pointed. Flat skew = complacency. Steep put skew = hedging demand. Call skew = speculative mania. That's free positioning intel most retail traders never even look at.
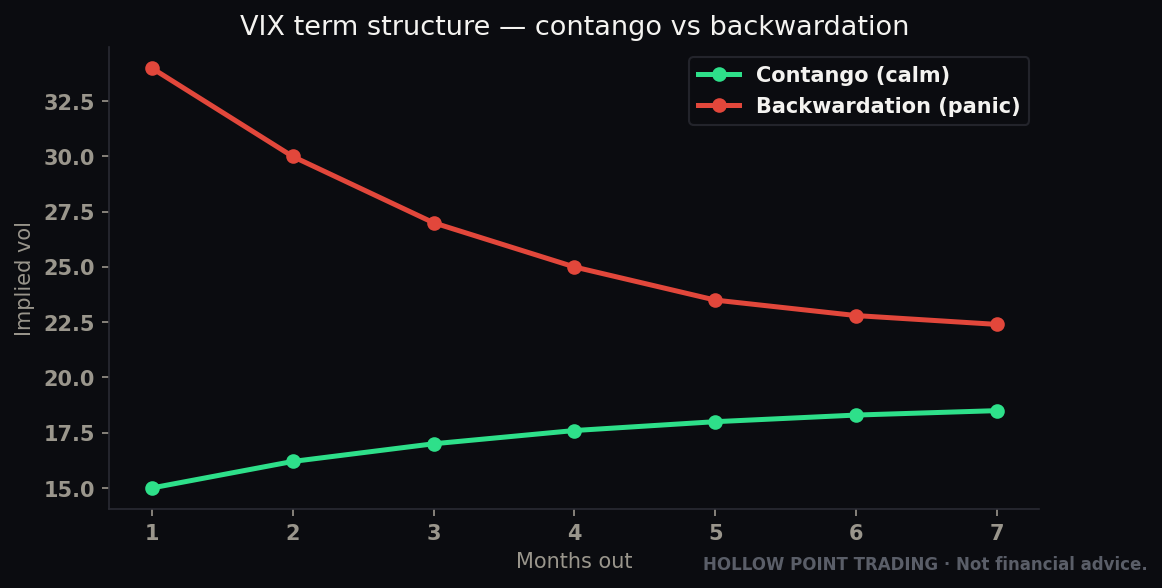
Skew also has a term-structure dimension: compare ATM IV across expirations, not just strikes. Normally further-out expirations carry higher IV than near ones (more time, more uncertainty) — an upward-sloping "term structure." But when near-dated IV spikes above far-dated — an inverted term structure — the market is pricing acute, imminent stress: an earnings report this week, a binary event, a panic. Inversion is a flashing light that the fear is concentrated in the very short term, which changes both your expiration choice and whether you want to be long or short that premium at all.
The Greeks columns: the option's physics
Most chains let you toggle on columns for the Greeks — the sensitivities that describe how the option's price will change. Define each once:
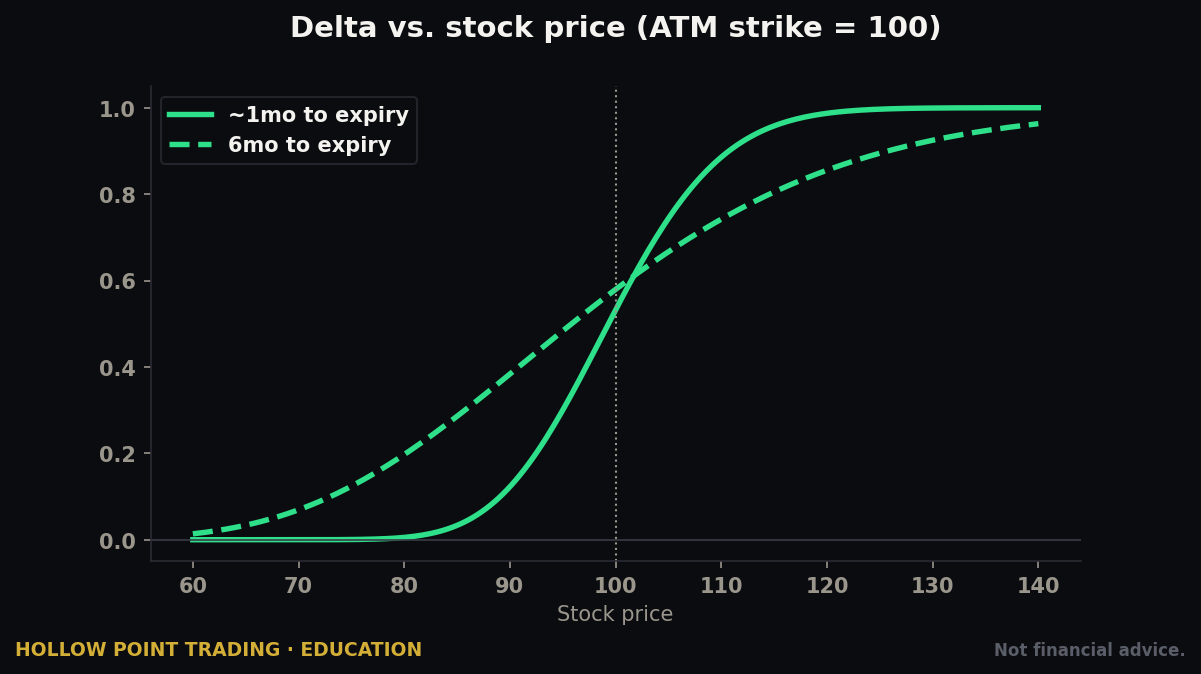
- Delta — how much the option price moves per $1 move in the underlying. A 0.50 delta call gains ~$0.50 (×100 = $50) if the stock rises $1. Delta also doubles as a rough probability of finishing in the money: a 0.30 delta option has roughly a 30% chance of expiring ITM. ATM ≈ 0.50. Deep ITM → toward 1.00. Far OTM → toward 0. This is the Greek you'll use most.
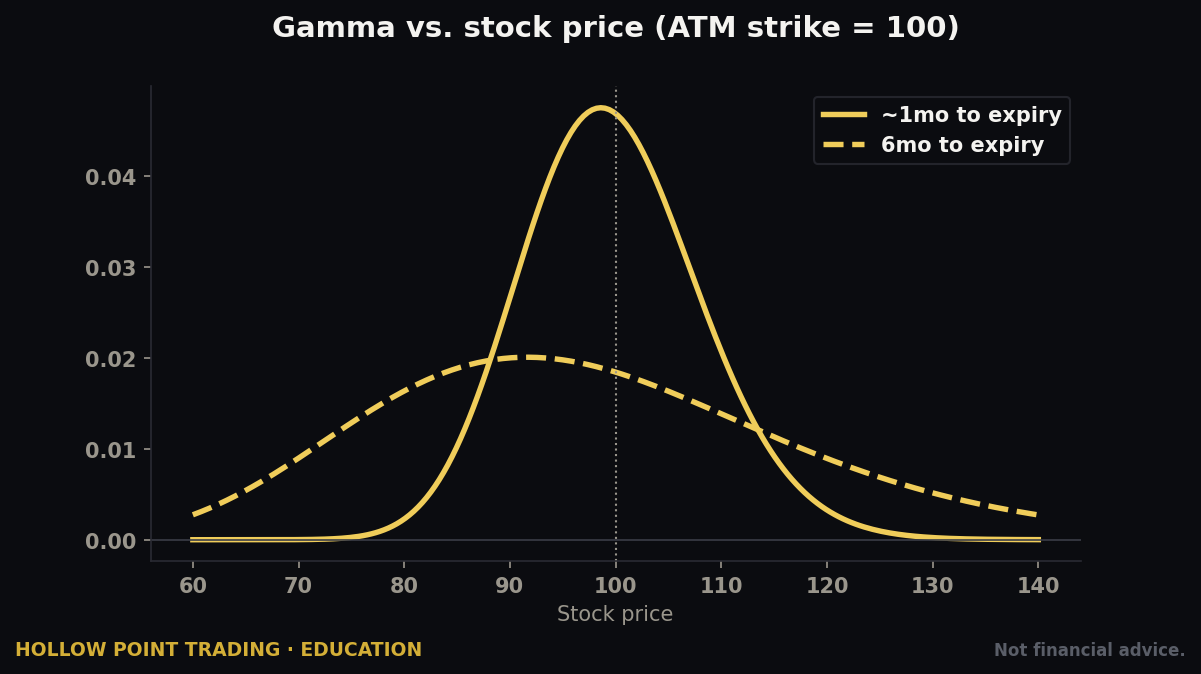
- Gamma — how fast delta itself changes as the stock moves. Highest at ATM, highest near expiration. High gamma means your delta (and your P&L) swings violently — the source of both the lottery-ticket wins and the whipsaw wipeouts on short-dated ATM options.
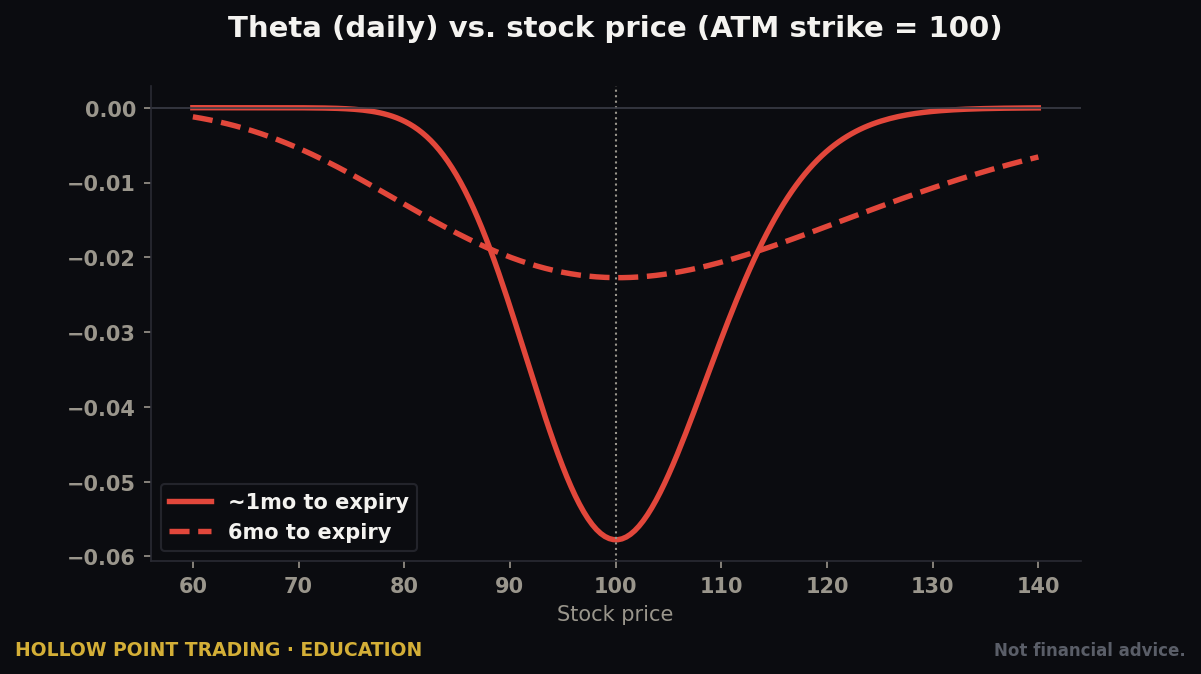
- Theta — time decay. How much value the option loses per day just from the clock ticking, all else equal. Theta is negative for buyers (you bleed daily) and positive for sellers (you collect daily). It accelerates as expiration approaches, especially in the final two weeks. A −0.15 theta means you lose $15/day per contract to time.
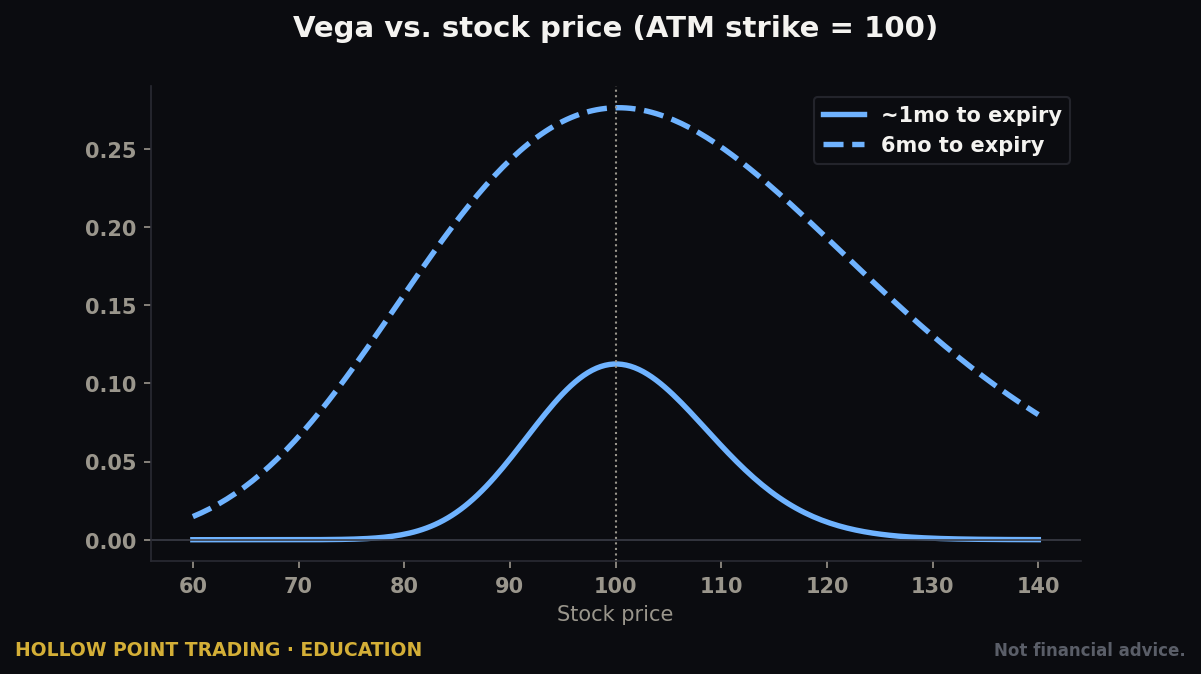
- Vega — sensitivity to IV. How much the option gains or loses per 1-point change in implied volatility. High vega = your P&L is heavily exposed to IV swings. This is why the earnings IV-crush trade kills you: high vega × big IV drop = large loss even if delta was right.
- Rho — sensitivity to interest rates. Matters for long-dated options; ignore it for anything under a few months.
The Greeks turn the chain from "prices" into "physics." Once you can read them, you know not just what a contract costs but how it will behave — how it responds to price, time, and fear. That's the difference between gambling and trading.
How the Greeks fight each other
The Greeks aren't independent dials — they're in constant tension, and the trade-offs are what separate a strike you can hold from one that shakes you out. Gamma and theta are enemies. The juiciest gamma (ATM, short-dated) carries the most brutal theta — the market pricing symmetry; you can't have explosive upside sensitivity without paying explosive decay. A 0DTE ATM option is a razor: P&L doubles on a small move, but it's worth 30% less by lunch if nothing happens. Delta and gamma compound in your favor when you're right (gamma pushes delta higher as the stock runs your way) and against you when you're wrong. Vega is the wild card that can override all of them: nail delta and get destroyed by IV crush, or be flat on direction and profit purely from an IV spike. Picking a strike and expiry is tuning the balance of these four forces. Beginners look only at delta; traders feel all four at once.
Expirations: weeklies, monthlies, and the calendar
Across the top of the chain you choose the expiration. Two categories to know:
- Monthlies — the original standard, expiring the third Friday of each month. These are the most liquid, have the tightest spreads, and are what most institutional flow uses. Quarterly monthlies (Mar/Jun/Sep/Dec) are the deepest of all.
- Weeklies — expire (typically) every Friday, and on the most liquid names like SPY, QQQ, and major single stocks, they now expire multiple days a week — the "0DTE" (zero-days-to-expiration) phenomenon lives here. Weeklies give you precision and cheap premium (less time = less theta baked in) but they decay brutally fast and gamma is savage.
Longer out, you'll find LEAPS — options expiring nine months to two-plus years away. These behave more like stock (high delta, low theta per day) and are used for long-term directional bets or stock replacement.
The trade-off is always the same: shorter expiration = cheaper, faster decay, higher gamma, less room for error. Longer expiration = more expensive, slower decay, more time to be right. Your expiration choice is really a choice about how much time your thesis needs to play out, plus a buffer. And note the theta curve isn't linear — a 60-day option barely decays day to day, but that same option in its final two weeks sheds value at an accelerating rate, and in the final days it falls off a cliff. This is why a common discipline among premium buyers is to avoid holding long options into the last week or two unless they specifically want that gamma, and why premium sellers love exactly that window — they're harvesting the steepest part of the decay curve.
How to Read and Use It: Worked Examples
Now let's put it together with real, worked examples. I'll keep the platform differences honest because the layout changes but the instruments don't.
Example 1: Orienting on a fresh chain (thinkorswim / Schwab)
You open thinkorswim's Trade tab on a stock — call it XYZ, trading at $152.40. The chain shows calls on the left, puts on the right, strikes down the middle, expirations as expandable rows you click to open. You turn on columns for Delta, Theta, IV, Volume, and Open Interest via the layout gear.
First move, always: find the ATM line. The shading flips between the 152 and 153 strikes. The 152.5 call is showing Delta 0.52, the 152.5 put Delta −0.48. Good — that confirms 152.5 is your at-the-money pivot.
Now scan liquidity. The ATM weekly 152.5 call: bid 2.05 / ask 2.10, volume 8,400, OI 12,000. Five-cent spread on a two-dollar option — tight, liquid, tradeable. Compare the 170 call three weeks out: bid 0.15 / ask 0.35, volume 12, OI 90. That's a 20-cent spread on a 25-cent option — a lottery ticket with a robbery attached. Same chain, wildly different tradeability. The columns told you in two seconds.
Example 2: Reading IV and skew before earnings (Tastytrade)
Tastytrade's chain foregrounds volatility — it's built by options-sellers, so IV and probability-ITM (its version of delta) sit front and center. XYZ reports earnings next week. You flip to the weekly that expires just after earnings.
The ATM IV reads 88%. You flip to the weekly before earnings — IV there is 41%. That gap is the market pricing the earnings move into the post-earnings expiry. Tastytrade even shows an "expected move" — say ±$11 — derived straight from the ATM straddle price on that expiry.
Now you scan the skew: the OTM puts (the 135, 130 strikes) show IV of 95–100%, while the equidistant OTM calls (170, 175) show 82%. Put skew is steep — the market's fear is pointed down. If your thesis is bullish, that steep put skew is also a gift: it makes put-selling (a bullish, premium-collecting trade) richer.
The lesson the chain is teaching: buying a naked call here means paying 88% IV into a guaranteed IV crush. Even a correct bullish call could lose. The chain is telling you to either sell premium, use a spread that's less vega-exposed, or wait for the crush and trade the aftermath. Put a number on the crush before you decide: if you expect IV to fall from 88% to ~45% post-report and your call carries a vega of 0.12, that's roughly 43 points × 0.12 = $5.16 of premium bled away per contract on the IV move alone. The stock would have to move enough for delta to more than cover that $516 hole just for you to break even. That's the trade you're actually taking when you "buy a call into earnings." The chain shows you the bill in advance.
Example 3: The retail-simple view (Robinhood / Webull)
Robinhood strips the chain down: you pick call or put, pick expiration, then see a single column of strikes with a price and (if you dig into the detail view) delta, IV, volume, OI, and the Greeks. It hides the mirrored calls/puts grid to reduce overwhelm — which is friendlier for beginners but costs you the skew read because you can't see calls and puts side by side.
The trap on these simplified platforms: they show you the last price or the mark prominently and bury the bid/ask. A beginner sees "0.85" and thinks that's the price. But bid is 0.70 and ask is 1.00 — a 30-cent spread. Buy at ask, and you're instantly down 30% before the stock moves a penny. Always tap into the detail to find the real bid/ask before you trade on a stripped-down chain. And because these platforms make one-tap buying so frictionless, they make the two most expensive mistakes — paying the ask and buying too little time — the easiest mistakes. The interface is optimized for order flow, not for your edge. Slow down and pull the real numbers before every click.
Example 4: Reading the OI wall (any platform, index options)
You pull up SPY's chain for this Friday. Spot is $598. You scan open interest down the strikes and one number jumps: the 600 call has 85,000 OI while neighbors have 10–20k. The 595 put has 70,000 OI. Those are walls. Massive dealer positioning at 595 and 600.
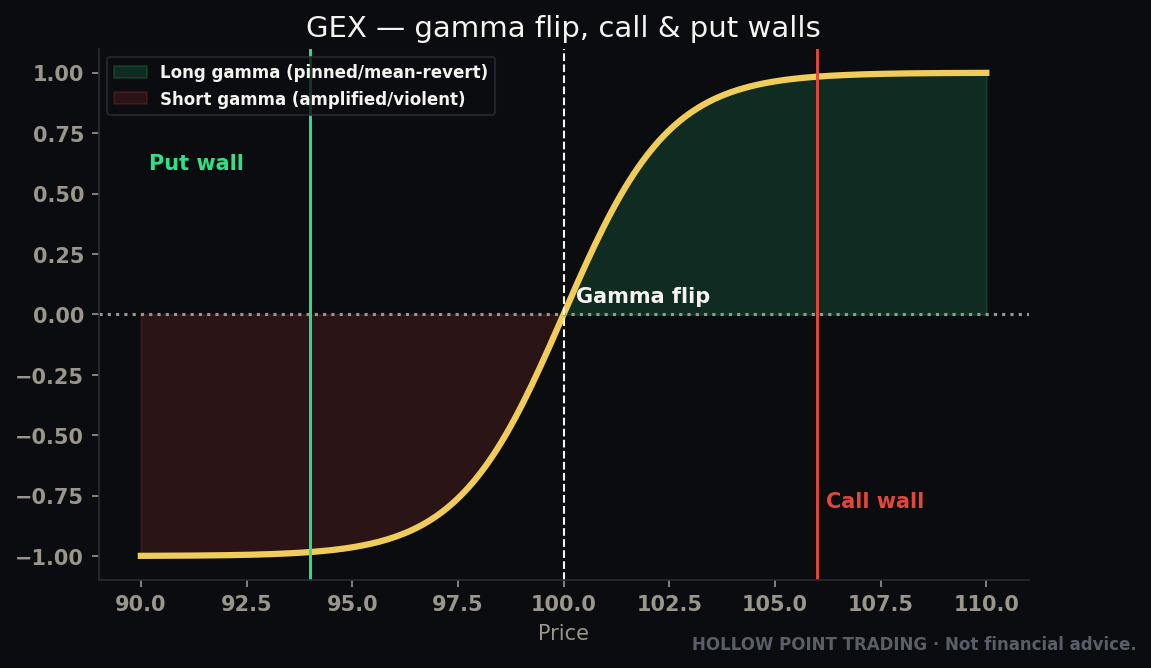
Into Friday expiration, price often gets "pinned" between big OI walls as dealers hedge their gamma — buying dips, selling rips — mechanically compressing price toward those strikes. It's not a guarantee, but knowing 595–600 is a magnet zone changes how you trade the day: you fade the edges of the range rather than chasing a breakout that the options positioning is fighting. That read came entirely from the OI column. This is the bridge to gamma-exposure (GEX) analysis, but you don't need a fancy terminal to start — the raw OI on the chain is the seed of it.
One nuance most people miss: a wall is only a magnet while dealers are net-long gamma and hedging toward it. If a big level breaks — price pushes decisively through the 600 call wall — that positioning can flip and accelerate the move as dealers chase their hedges (the classic "gamma squeeze"). So a wall is two-sided: a magnet on approach, a rocket booster on a clean break. Watch how price behaves at the wall — rejection means the pin is holding; a strong close through it on volume means the pin snapped and the hedging flow just reversed.
Example 5: Interactive Brokers / TradingView — same instruments, denser cockpit
IBKR's TWS and TradingView's options chain look more intimidating because they show more columns at once and let you customize heavily. But nothing new is happening — it's the same instruments, just more of them visible simultaneously. On TradingView you can flip an expiration dropdown, see calls/puts mirrored with IV and Greeks toggled per column, and read the skew and OI walls in one glance. The skill transfers perfectly across every platform because the underlying grid is identical — two axes, mirrored halves, the same instruments. Learn it once, read it anywhere.
Example 6: When the chain says "don't trade this at all"
Not every read ends in a trade — a good chain-reader books just as much value from the trades they skip. You like a small-cap breakout on the chart, spot $41. The chain greets you with: nearest expiration three weeks out (no weeklies), strikes $5 apart (so your ATM choice is 40 or 45, both far from spot), the 40 call bid 1.20 / ask 2.30 (a 91-cent spread, a 60%+ tax), OI under 200 across the board, and IV 140% with no earnings to justify it. Every instrument flashes the same warning: illiquid, expensive, imprecise, untradeable. The chart looked great; the chain said no. The disciplined trader trades the stock instead, or passes. Reading the chain well means being willing to hear "no" from it — the grid protects your capital as often as it deploys it.
The Multi-Timeframe Read on the Chain
The chart has timeframes; so does the chain, and the two must agree before you commit. The chain's "timeframe" is its expiration ladder — near-dated weeklies are your fast timeframe, monthlies your intermediate, LEAPS your slow. Reading across them is exactly like reading a 5-minute against a daily.
Start with the far-dated expirations to read structural positioning. Where are the big OI walls three and six months out? Those are the levels institutions are defending or targeting on a slow horizon — they line up with major chart structure and macro pivots. Then drop to the near-dated weekly to read tactical positioning: where's today's flow, where's the 0DTE gamma, where's the pin for this Friday. When the far-dated walls and the near-dated walls stack at the same price, that's a high-conviction level — the equivalent of a daily and a 5-minute both respecting the same line. When they disagree — big far-dated call OI up at 620 but the weekly pinned at 598 — you've got a "slow bullish, fast neutral" read, and you trade the near-term range while respecting the longer-term magnet above.
The expected-move numbers stack the same way. If the weekly expected move is ±$6 and the monthly is ±$14, the market foresees most of its action spread across the coming weeks, not concentrated now. Match your expiry to the timeframe on which your thesis and the chain's implied move actually agree.
The Chain in Different Market Regimes
The exact same chain reads differently depending on what kind of market you're in. A strike selection that's disciplined in a calm trend is reckless in a high-vol panic. Three regimes, three different postures.
Trending market (steady, directional, moderate IV)
In a clean trend with orderly volatility, IV rank tends to sit low-to-moderate — the market isn't scared, it's just going. This is the friendliest regime for buying directional options. Premium is reasonable, IV crush risk is low outside of scheduled events, and a slightly-ITM call or put (0.60–0.70 delta) tracks the trend beautifully with manageable theta. Skew is present but not extreme. OI walls tend to act as continuation levels — price uses them as launchpads rather than ceilings. The discipline here: pick enough time, size for the trend, and don't overpay for a move the market isn't pricing as urgent.
Choppy / range-bound market (sideways, mean-reverting, low-to-mid IV)
In chop, buying directional options is a slow death — theta bleeds you while price goes nowhere and whipsaws your delta. This is the regime that favors the sellers. The chain's OI walls define the range edges, IV is often modestly elevated relative to the actual (small) realized moves, and the edge shifts to collecting premium — selling the strikes at the range extremes, running credit spreads and iron condors that profit from price staying boxed. If you insist on being long options in chop, you want spreads that cut theta and vega, not naked longs. The chain's message in chop: stop paying for movement that isn't coming; get paid for it not coming.
High-volatility / panic market (fast, gapping, elevated IV)
When VIX is bid and the tape is gapping, the whole chain inflates. IV rank spikes toward the top of its range, spreads widen even on liquid names, skew steepens hard as everyone grabs puts, and expected moves balloon. Two things change. First, long premium is expensive and vega-dangerous — you can be right on direction and still lose when IV mean-reverts down off the panic. Second, premium selling is richer but far riskier — you're paid a lot precisely because the tail risk is real, and an iron condor that "always works" in calm markets can be blown through in a single gap. The disciplined posture: smaller size, defined-risk structures only, respect the widened expected move, and never sell naked into a panic for the fat premium — it's fat for a reason. The chain in high vol is loud; the correct response is quiet and small.
Combining the Chain With Other Tools (Confluence)
The chain is powerful alone but decisive in confluence. Three pairings do the heavy lifting.
Chain + price structure (EMAs and key levels)
This is the core HPT stack. Your chart gives you trend and levels; the chain gives you positioning at those levels. The magic is alignment. Suppose your daily chart shows price above a rising 55 EMA (bullish bias) and a clear resistance shelf at $600. Now you open the chain and the biggest call OI wall sits at exactly 600. That's two independent instruments — pure price structure and pure options positioning — pointing at the same price. When they agree, conviction goes up and the level becomes a genuine decision point: rejection there is a high-quality short-term fade, a clean break through it is a high-quality continuation (and possibly a gamma-squeeze accelerant). When the chart level and the OI wall disagree, you've lost your confluence and you size down or stand aside.
Chain + volume profile / VWAP
Volume profile shows where shares actually changed hands — the point of control (POC) and value area are shares-based magnets. OI walls are options-based magnets. When a POC sits at the same price as a big OI wall, you have a double magnet: heavy underlying interest and heavy options interest at one level — the prices that pin hardest and reject cleanest. Anchored VWAP adds a third vote: if the aVWAP from a major swing is also coiling into that level, three structurally independent tools name one price. That's the confluence you build a defined-risk trade around, because if it fails, it fails clearly and your invalidation is obvious.
Chain + IV rank + the event calendar
Direction is only half the trade; the other half is whether to buy or sell premium, and that's decided by IV rank cross-checked against the calendar. Before every options trade, two questions: where is IV rank (high → sell, low → buy), and is there a scheduled catalyst (earnings, Fed, CPI, product event, FDA date) inside my expiration window? The calendar tells you why IV is where it is. High IV rank with an earnings report in three days is not a "sell premium" green light — it's an "IV crush is coming, structure accordingly" warning. High IV rank with a clear calendar (no events, just elevated fear) is a much cleaner premium-selling setup. The chain's IV column and the earnings calendar are two tools that only make sense read together.
How It Fits the HPT Top-Down Process
At Hollow Point Trading the chain never comes first. It comes last — after the top-down read has already told you what you're looking for. Here's the sequence.
Macro → Sector → Stock → Structure → Chain. You start at the top. What's the broad market doing — risk-on or risk-off, VIX bid or bleeding? Which sectors are leading? Is your name in a strong sector or a weak one? Then you drop to the individual chart and read structure the HPT way: EMA 12/22/55 stack for trend (price above a rising 55 = bullish bias; the daily 55 is the bias tell), timeframe-weighted confluence, key levels, the setup. Only after you have a thesis and an invalidation level do you open the chain.
Because here's the thing new traders get backwards: the chart tells you direction and levels; the chain tells you the vehicle. You don't hunt the chain for a trade idea. You bring the idea to the chain and let it price the cleanest way to express it.

So the chain reads through the HPT lens like this:
- Thesis defines expiration. HPT runs a minimum 1:3 reward-to-risk and doesn't want to be a hostage to theta. If your structural thesis says the move plays out over the next two weeks, you do not buy a 3-day weekly and let decay eat you alive. You buy an expiration with a buffer — typically enough time that your thesis can breathe plus a week, so a slow start doesn't kill you before you're right. Time is the risk you control by choosing the expiry.
- Invalidation defines the stop, and delta right-sizes it. Your chart gives you the invalidation price — where the 55 EMA breaks, where structure fails. That's your stop. A higher-delta option (0.60–0.70, slightly ITM) moves more like the stock and behaves predictably against that stop. A far-OTM lotto (0.15 delta) can be right on direction and still expire worthless because it needed a bigger move than your thesis called for. HPT discipline favors the strike that pays you for being right, not the one that needs a miracle.
- IV rank gates the structure of the trade. Before you buy anything, check where IV sits. High IV rank? You're overpaying for premium — lean toward selling premium (spreads, cash-secured puts) or use debit spreads to cut vega. Low IV rank? Long options are cheap — buying calls/puts is more forgiving. The chain's IV column decides whether you're a net buyer or seller before direction even enters.
- Confluence, not conviction. The same way HPT weights multiple timeframes agreeing, you want the chain confirming the chart. OI walls sitting right at your chart resistance? That's confluence — two independent instruments pointing at the same level. Skew leaning your direction? Another vote. When the chain and the structure disagree, you size down or stand aside. Discipline over prediction.
The chain, in the HPT frame, is the final filter that turns a chart read into an executable trade with defined risk. It doesn't generate the idea. It prices it, sizes it, and tells you the honest cost of being wrong.
Picking the Strike and Expiry: A Live Walkthrough
Let's make it concrete end to end. XYZ at $152.40. Your HPT read: daily above a rising 55 EMA (bullish bias), price just reclaimed the 150 level on the 4H with confluence, structure targets $165 over the next two to three weeks, invalidation is a 4H close back below $148.
Step 1 — Expiration. Thesis needs ~2–3 weeks. You add a buffer and pick the monthly ~5 weeks out. Enough time that a slow start doesn't bleed you; not so far that you overpay for time you won't use.
Step 2 — IV check. IV rank is moderate, 35%. No earnings inside your window (you checked — always check). Premium is fair. Long calls or a debit spread both viable; you'll compare.
Step 3 — Strike via delta. You want to move with the stock and survive a shaky start, so you look at a slightly-ITM/near-ATM strike around 0.60 delta — the 150 call. It's bid 6.30 / ask 6.45 (tight — liquid), delta 0.61, theta −0.09, IV 34%, volume 3,200, OI 9,500. At 0.61 delta, a move from 152 to 165 (+$13) gains you roughly $8 of intrinsic plus retained time value — call it the contract roughly doubling, while your $148 invalidation caps the downside. That's inside a 1:3 R/R.
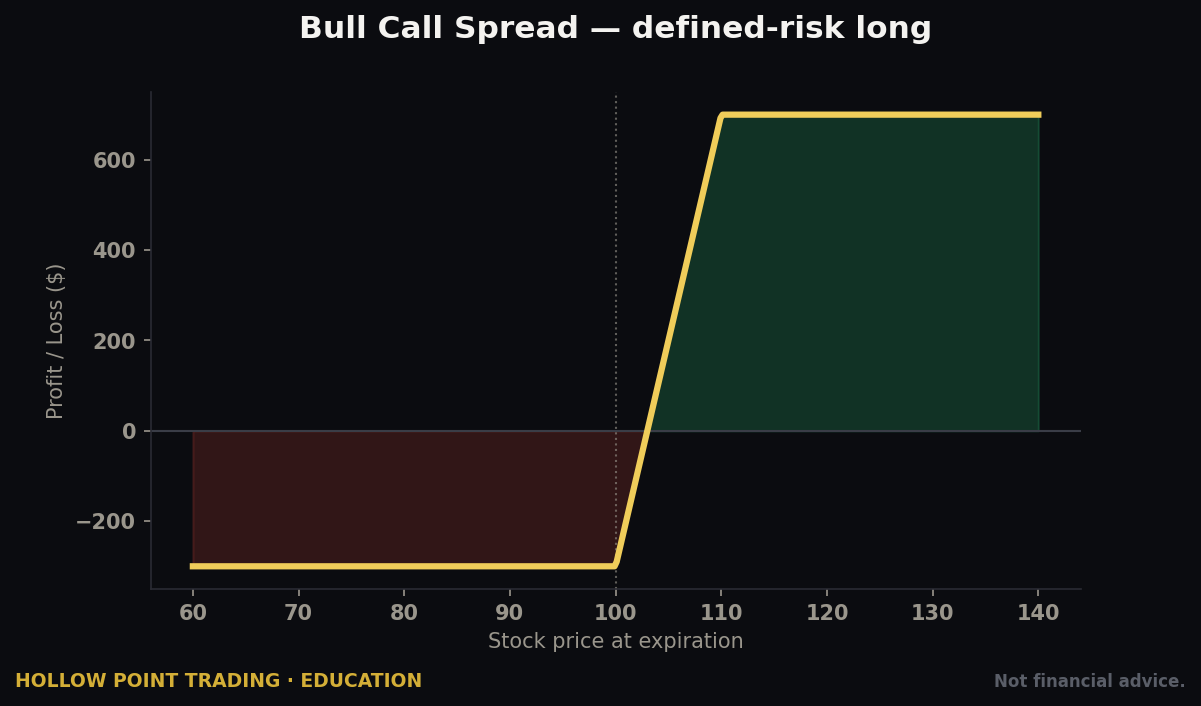
Step 4 — Consider the spread alternative. IV's only moderate, so straight long calls are fine, but you price a 150/165 debit spread anyway: buy the 150 call, sell the 165 call (your target). It cuts your cost and your vega, caps your gain at 165 (where you were taking profit regardless), and lowers your break-even. If IV were high, this is the trade. At moderate IV, you might take the naked 150 call for cleaner upside — a judgment call the chain lets you make with eyes open.
Step 5 — Execute at the mark. Bid 6.30 / ask 6.45, you work the order at 6.37 (the mark), not the ask. Save the 8 cents × 100 = $8 per contract. On size that's real money, every time.
That's the whole discipline: chart makes the thesis, thesis picks the expiry, IV picks the structure, delta picks the strike, spread sets the fill. The chain didn't tell you what to trade — your top-down read did. The chain told you how to trade it cleanly, with defined risk, at a fair price.
A second walkthrough: the high-IV, bearish case
Now flip everything. XYZ at $152.40 again, but this time your read is bearish: price failed at the daily 55 EMA and rolled over, structure targets $135 over two weeks, invalidation is a reclaim of $156. And critically, IV rank is now high at 78% — the whole market is nervous, VIX bid.
Expiration. Two-week thesis plus a buffer → the monthly ~4 weeks out.
IV gate. High IV rank changes the whole structure. Buying a naked put here means paying rich premium and carrying big negative vega — if the panic eases and IV mean-reverts down, your put bleeds even as price drifts your way. That's the mirror image of the earnings-crush trap. So you lean toward a defined-risk debit spread to cut vega, or toward selling premium on the other side.
The put debit spread. Buy the 150 put, sell the 135 put (your target). The short 135 leg finances part of the long 150 leg and — because of the steep put skew in a high-IV tape — you're selling a leg that's especially inflated, which improves your pricing. Your max gain is capped at the 135 target you were exiting at anyway. Your cost and vega are both cut. Delta on the net position is a comfortable negative that tracks the down-move.
The premium-selling alternative. Because IV rank is high and your bias is down-to-neutral, you could instead sell a call credit spread above the failed 55 EMA — say short the 158 call, long the 162 call. You collect inflated premium, you profit if price stays below 158 (which your bearish thesis expects), and IV mean-reversion now works for you instead of against you. Same directional bias, opposite Greeks posture — and the chain's high IV rank is exactly what tips you toward this structure over the naked put. This is what "IV rank gates the structure before direction" looks like in practice.
Edge Cases and Gotchas the Chain Won't Warn You About
The instruments are honest, but a few situations distort what they show. Know these before they bite.
Dividends and early assignment. If you're short an ITM call into an ex-dividend date, you can be assigned early as the counterparty exercises to capture the dividend. The chain shows the price but not the assignment risk — you have to know the ex-div date yourself. Deep-ITM calls with little extrinsic value left are prime early-assignment candidates. (Relatedly, around ex-dividend put values firm and call values soften; that's the dividend being priced in, not a signal.)
Pin risk at expiration. If price closes exactly at your short strike on expiration day, you don't know for certain whether you'll be assigned — and can wake up with an unexpected stock position Monday. The clean fix: close expiring short options that are near the money rather than riding the settlement lottery.
Stale quotes and phantom liquidity. On thin strikes the displayed bid/ask can be a market maker's placeholder, not a workable market, and "last" might be hours old. You only learn the true market when you route an order and watch where it fills. Treat thin-strike quotes as approximate.
Wide markets around the open and close. Spreads are widest in the first minutes after the open (before makers calibrate) and can gap into the close — an option with a 3-cent spread at 11 a.m. might show 15 cents at 9:31. Don't assume the open's spreads hold all day.
Corporate actions. Splits, special dividends, mergers, and spinoffs adjust strikes and deliverables, producing odd non-standard strikes. If you see bizarre increments or an "adjusted" flag, the contract has a non-standard deliverable — read the adjustment memo before trading it.
How the Pros Use It Differently From Beginners
Same chain, completely different eyes. The gap isn't information — it's all right there for both of them — it's habit and sequence.
A beginner opens the chain first, scrolls to whatever's cheap, looks at the last price, imagines the upside, and clicks buy — usually a short-dated OTM call, because it's cheap and the payoff fantasy is biggest. They ignore IV, spread, and OI, and confuse "low dollar cost" with "low risk." They read the chain as a menu of lottery tickets.
A professional opens the chart first and forms a thesis with a defined invalidation before touching the chain, then reads the chain as a risk instrument. They check IV rank to decide buyer-or-seller before direction; read the expected move and ask whether their target is even inside it; read OI for confluence with their chart levels; pick a delta that survives a shaky start; price at least one spread alternative; and work the fill at the mark because pennies compound over hundreds of trades. And crucially, they let the chain talk them out of trades — a bad spread, an IV-crush setup, an untradeable liquidity profile — as often as into them.
The deepest difference: a beginner uses the chain to answer "what could I win?" A professional asks "what's the honest cost of being wrong, and is the reward at least three times that?" One reads for hope, the other for risk. The chain rewards the second reader with mechanical consistency over years, and quietly bankrupts the first.
There's also a subtler pro habit: pros read the chain for what other people are forced to do. Big OI walls, steep skew, inverted term structure, and gamma positioning are constraints on dealers and funds who must hedge mechanically. Anticipating that forced flow — the pin into a wall, the squeeze through it, the vol-seller's cover in a panic — is the graduate-level read of the same grid the beginner uses to buy a cheap call. Same numbers. One reads their own hope; the other reads the whole market's obligations.
Frequently Asked Questions
Should a beginner buy or sell options first? Buy, to learn — with tiny size and defined risk. Buying caps your loss at the premium, which makes the learning curve survivable. Selling naked options can lose far more than you collect, and it demands a feel for probability and risk you won't have yet. Learn to read the chain and buy defined-risk structures first; graduate to selling premium once IV rank and the Greeks are second nature.
What delta should I buy? For directional trades where you want to track the stock and survive a shaky start, roughly 0.55–0.70 — slightly ITM to ATM. Far-OTM low-delta options (0.10–0.20) are cheap because they usually expire worthless; they need an outsized move just to break even. Higher delta costs more in dollars but is far more forgiving, and it's what HPT discipline favors: pay to be right, don't gamble on a miracle.
How much time should I buy? Match the expiration to how long your thesis needs to play out, then add a buffer — often "thesis window plus about a week." Never buy a 3-day weekly for a two-week thesis; theta will bleed you out before you're right. The exception is if you specifically want gamma for a same-day catalyst and accept the brutal decay.
Why did my option lose money when I was right on direction? Almost always one of three things: IV crush (bought inflated premium into a known event and IV collapsed), theta (the stock moved too slowly and decay outran your gains), or the spread (bought at the ask, started deep in the hole). All three are visible on the chain before you trade. Read the IV, match the time, price at the mark.
Is high open interest bullish or bearish? Neither by itself. OI just marks where large positions sit — a wall that can act as support, resistance, a magnet into expiration, or a squeeze accelerant on a break. Its directional meaning comes from where price sits relative to it and how price behaves when it gets there. Read OI as a level, not a signal.
What's the difference between IV and IV rank? IV is the raw number — the market's forecast of movement. IV rank puts that number in context by comparing it to the same stock's IV over the past year. 45% IV is meaningless alone; IV rank tells you whether 45% is cheap or expensive for this name. Always look at rank, not the raw figure, when deciding to buy or sell premium.
Can I read the chain the same way on every broker? Yes. Layouts differ — some hide the mirrored grid, some bury the bid/ask, some pack in extra columns — but the instruments are identical everywhere: two axes, calls/puts, bid/ask/mark, volume/OI, IV, and the Greeks. Learn them once and read any platform in seconds.
Do I need a fancy GEX/gamma terminal? Not to start. The raw open-interest column on any free chain is the seed of gamma analysis: find the big walls, note where price sits relative to them, watch how it behaves there. A dedicated terminal refines the read, but the free chain gives you most of it.
The Cheat-Sheet
Pin this. It's the whole cockpit in one panel.
The two axes
- Strikes run vertical (the ladder). Expirations run horizontal (the tabs).
- Calls left, puts right. Find the ATM line first — where the shading flips.
- Multiplier is 100: a premium of 2.10 costs $210 and controls 100 shares.
Orientation — ITM / ATM / OTM
- Calls: ITM below spot, OTM above. Puts: ITM above spot, OTM below.
- ATM = strike nearest spot = max time value, max gamma, most active.
- Price = intrinsic (real, guaranteed) + extrinsic (time/hope). OTM = pure hope.
Price columns
- Bid = you sell here. Ask = you buy here. Last = stale, ignore as an anchor.
- Mark = (bid+ask)/2 = fair value = price from this. Work orders at the mark.
- Spread = ask − bid = your liquidity read. Tight = good. Wide = tax/avoid.
- The spread taxes you twice — entry and exit. On thin strikes it can eat 20–30%.
Flow columns
- Volume = contracts traded today (resets daily) = today's action.
- Open Interest = contracts outstanding (updates overnight) = standing crowd.
- High OI strike = wall / magnet near expiry; a clean break can flip it to a squeeze.
Volatility
- IV = market's forecast of movement = the price of expectation. High = expensive.
- IV rank/percentile = IV vs this stock's own year. THIS decides buy vs sell, not raw IV.
- Expected move ≈ ATM straddle price. Is your target even inside it?
- IV crush = the drop after a known event (earnings). Never buy naked options into it.
- Skew = IV across strikes. Put skew (steeper) = downside fear. Call skew = upside chase.
- Term structure inverted (near IV > far IV) = acute, imminent stress priced in.
Greeks
- Delta = $ move per $1 in stock ≈ probability of finishing ITM. Your main dial.
- Gamma = how fast delta moves. Highest ATM & near expiry. Whipsaw source.
- Theta = daily time decay. Negative for buyers. Accelerates into the final two weeks.
- Vega = sensitivity to IV. Why IV crush hurts even when direction is right.
- Gamma vs theta are enemies; the juiciest gamma carries the harshest decay.
Expirations
- Weeklies/0DTE = cheap, precise, brutal decay, savage gamma.
- Monthlies (3rd Friday) = most liquid, tightest spreads, the default.
- LEAPS = 9mo–2yr, behave like stock, for long-term / stock replacement.
- Shorter = cheaper + faster decay + less room. Longer = pricier + more time to be right.
Regime posture
- Trend, moderate IV → buy slightly-ITM directional (0.60–0.70 delta).
- Chop, mid IV → sell premium at range edges; spreads over naked longs.
- High vol/panic → smaller size, defined risk only, respect the widened move, no naked selling.
The HPT selection sequence
- Macro → sector → stock → structure (EMA 12/22/55) → then the chain.
- Thesis timeframe picks the expiration (+ a buffer; no theta hostages).
- IV rank picks the structure (long vs spread vs sell premium).
- Delta picks the strike (0.55–0.70 to move with the stock; skip far-OTM lotto).
- Chart invalidation = the stop. Confirm 1:3 R/R. Work the fill at the mark.
The deadly sins Cheapest option · paying the ask · ignoring IV into earnings · confusing volume/OI · anchoring to last · trading illiquid strikes · too little time · mistaking low dollar cost for low risk · reading the chain to generate ideas.
The Common Mistakes
Every one of these is a chain-reading failure, and every one is avoidable.
Buying the cheapest option. The far-OTM contract is cheap because it probably expires worthless. Price is not value. A 0.10-delta call at $0.20 has a ~10% chance of finishing ITM — you're buying a 90%-loss lottery ticket. Cheap is a warning, not a bargain. The right question is never "what can I afford?" but "what delta and expiry does my thesis actually require?"
Paying the ask on a wide spread. You saw the trade, you clicked buy, you hit the ask. On a 30-cent spread you just gave away 15–30% of your capital to the market maker before the stock moved. Always find the mark. Always work the order. On wide spreads, don't trade at all.
Ignoring IV before earnings. The single most expensive rookie mistake. You buy a call into earnings, you're right on direction, and IV crush eats your entire gain and then some. The IV column was at 90%. It was telling you the premium was inflated and about to deflate. Read it — and if you must be in, use a structure that isn't net-long vega.
Confusing volume and open interest. Seeing high volume and thinking "high OI = strong support" or vice versa. They're different instruments. Volume is today's traffic; OI is the parked cars. Know which you're reading, because they lead to opposite conclusions about whether positioning is fresh or standing.

Confusing last price with the real price. Last can be stale by hours on an illiquid strike. You anchor to it, then get a fill 20% away because the actual bid/ask had moved. Price from the mark, never the last.
Trading illiquid strikes. Single-digit volume, near-zero OI, wide spread. You can get in, but when you need to get out — especially when you're wrong and want out fast — there's no one there. You're trapped, selling into a market maker who owns you. Liquidity is an exit strategy, not a nicety.
Too little time. Buying a 3-day weekly for a thesis that needs two weeks. Theta and gamma make short-dated options a wasting asset that punishes any hesitation. Match expiry to thesis, then add a buffer. The clock is a risk you choose.
Reading the chain to generate ideas. Scrolling strikes looking for "a good trade" is backwards and it's how you end up chasing whatever's moving. The idea comes from the top-down chart read. The chain prices the idea you already have. Direction first, vehicle second — always.
Mistaking low dollar cost for low risk. A $30 far-OTM call feels "safe" because it's cheap, but its probability of total loss is far higher than a $600 ITM call's. Risk is about probability of loss and sizing, not the sticker price. New traders over-buy cheap junk because it "can't lose much" — and lose 100% of it, repeatedly.
Selling naked premium into a panic for the fat yield. In high-vol regimes the premium is fat because the tail risk is real. Selling naked puts or calls to harvest that juicy IV works until the one gap that blows through your strike and takes multiples of everything you collected. If you sell in high vol, define your risk — always.
Overtrading the 0DTE gamma. Same-day gamma is seductive — huge, fast wins. But the gamma that hands you a triple hands you a −80% just as fast, and theta eats the whole time. Treating 0DTE as consistent income rather than the razor it is drains accounts quietly.
Ignoring the event calendar. Buying or selling premium without checking for earnings, Fed meetings, CPI prints, or product events inside your expiration window is flying blind. The calendar is why IV is where it is; not checking it is how you walk into an IV crush or a gap you never saw coming.
The chain rewards the disciplined and punishes the impulsive with mechanical precision. Every instrument on it tells you the truth about cost, probability, and crowd positioning — you just have to read the gauges instead of grabbing the throttle. Do the top-down work first. Bring the thesis to the chain. Let the grid price it honestly, size it against a real invalidation, and tell you the true cost of being wrong. Then, and only then, fly it by the rules.
Bound by rules, feared by trade.